When developing and operating an application, observability is an important factor for successfully maintaining the application and evaluating its performance. The three primary aspects of observability are logs, metrics, and traces. In this blog post we’ll present how metrics and traces can be collected for applications deployed on Amazon Web Services (AWS) by using the AWS Distro for OpenTelementry (ADOT) without setting up and maintaining additional APM solutions. ADOT is a fork of the open-source project OpenTelemetry (OTEL), extending it with components, that simplify the integration of the OTEL data into existing AWS tools such as CloudWatch and X-Ray. We’ll look at the architecture of OpenTelemetry and show how AWS integrates OpenTelemetry, as well as the basic configuration necessary to automatically record traces and metrics from a Java application, which can then be viewed in X-Ray and CloudWatch. We’ll also discuss the cost of using this setup.
OpenTelemetry
OpenTelemetry is an open-source observability framework, that sets out to standardize and facilitate the collection of traces, metrics, and logs. It supports numerous languages [https://opentelemetry.io/docs/ (Java, Python, Go, Rust, PHP, C++…] and common frameworks [e.g., Java: https://github.com/open-telemetry/opentelemetry-java-instrumentation/blob/main/docs/supported-libraries.md]. While log support is still in the experimental phase at the time of writing, it offers a capable Java auto instrumentation agent that automatically collects traces and metrics from a Java application without requiring any code changes. To extend the automatically collected data with custom traces and metrics, the OpenTelemetry API may be used. Despite being vendor neutral, OpenTelemetry enjoys increasing support from commercial products, like AWS.
Architecture of OpenTelemetry
We’ve shown the anatomy of an APM (Application Performance Monitoring) solution in our previous blogpost “Open Application Performance Monitoring (APM) Standards – OpenTracing and OpenCensus”. The following diagram illustrates the general APM solution architecture. OpenTelemetry represents such a solution and in fact resulted from the merge the two standards OpenTracing and OpenCensus in 2019.
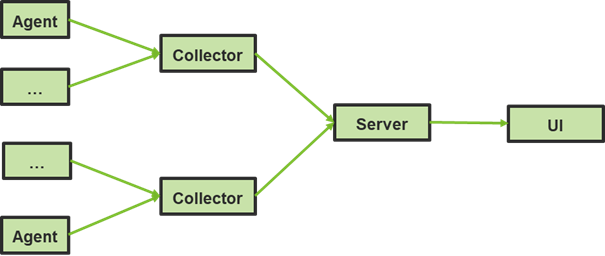
Figure 1: Anatomy of an APM solution
An application instance is instrumented with an agent, which is deployed as part of the application process or on the application’s host. The agent collects traces and metrics from the running application and forwards them to a collector, which bundles this data and forwards them to a server for storage. To explore the collected telemetry data, a UI retrieves the data from the server to display it.
The scope of the OpenTelemetry specification contains format definitions for metrics, traces and log data, API definitions to record them and protocol definitions to send them as telemetry data. OpenTelemetry also includes agent implementations for various languages, that can be installed into an application’s process to collect traces and metrics, as well as a Collector implementation, which receives data from the agents, transforms it and forwards it to one or more backend services to store and analyze the data, like Cloudwatch and X-Ray. As shown in the following diagram, the collector may be deployed as agent, which is a single collector instance running with the application on the same host as the application. It directly forwards collected data to a backend service. Alternatively, it may be deployed as gateway, consisting of one or more collector instances acting as a standalone collector service, which receives data from one or more agents and forwards it to the respective backends.
![[Figure 2: Otel reference architecture, source: https://opentelemetry.io/docs/]](https://www.retit.de/wp-content/uploads/2021/11/02_otel_reference_architecture.png)
[Figure 2: Otel reference architecture, source: https://opentelemetry.io/docs/]
OpenTelemetry data in X-Ray and Cloudwatch
X-Ray
X-Ray is an AWS service that enables users to collect distributed traces, search and filter them and gain insight into some statistics of the traces over time.
A trace viewed in X-Ray is broken down into its spans, showing their start, duration and information like the database query executed in the span as well as exceptions that occurred as shown in Figure 3 below.
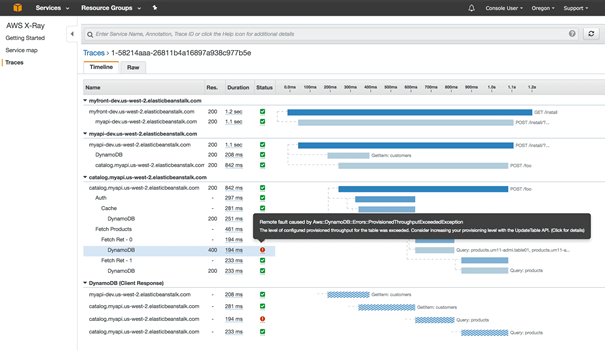
Figure 3.: X-Ray trace view (source: https://aws.amazon.com/xray/features/)
Another way of looking at the trace data is an aggregation called service map in X-Ray for which an example is shown in Figure 4. The X-Ray service map shows the calls between components of the recorded traces, including throughput and response times statistics for service calls per component.
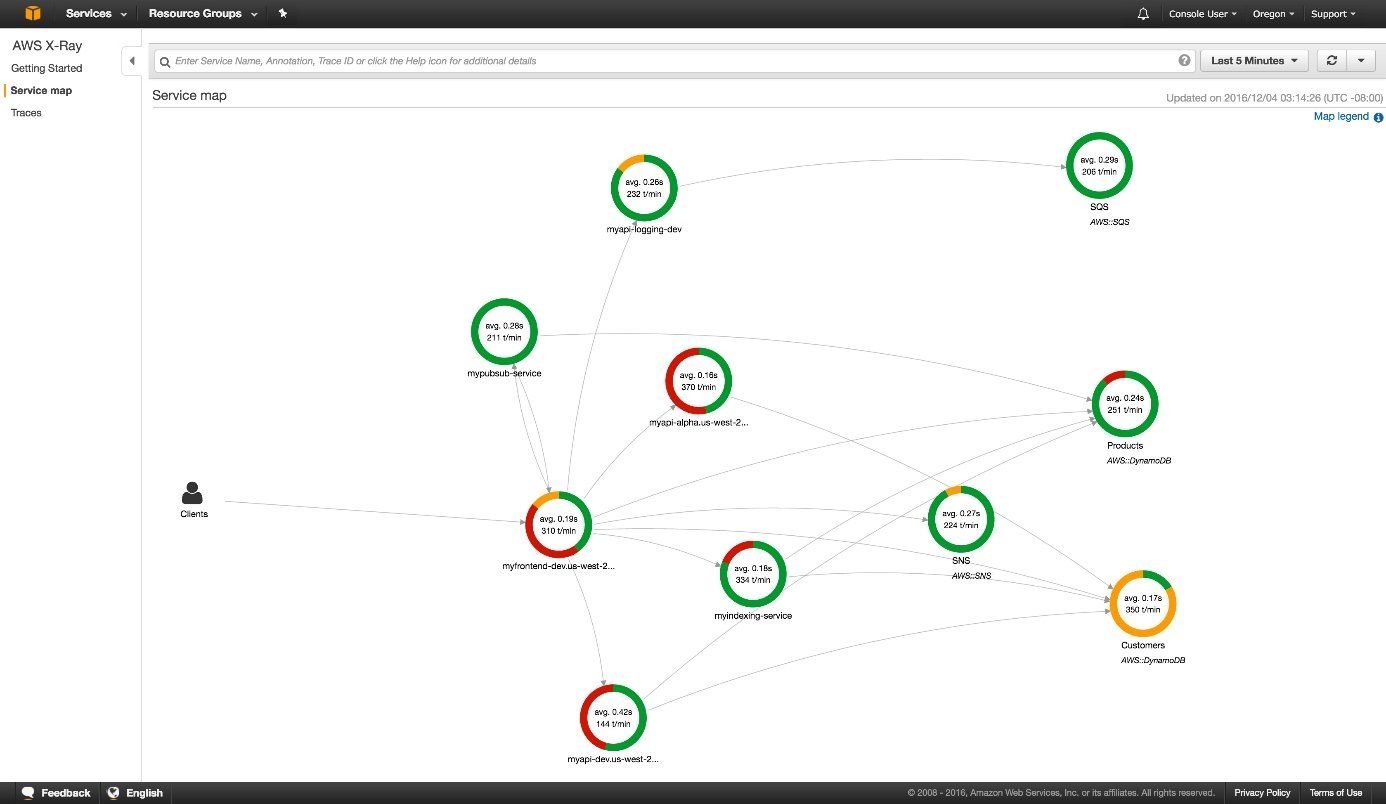
Figure 4.: X-Ray service map (source: https://aws.amazon.com/xray/features/)
CloudWatch
AWS CloudWatch is a monitoring service, that stores metrics and log data and lets you create graphs to visualize the metrics and define alarms based on thresholds you can set. In the following figure 5, an example is shown how a metric can be visualized in CloudWatch.
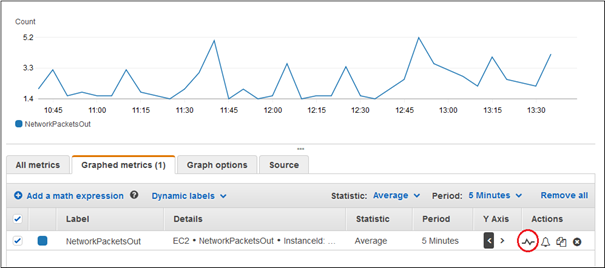
Figure 5.: CloudWatch graphed metrics view (Source: https://docs.aws.amazon.com/AmazonCloudWatch/latest/monitoring/graph_a_metric.html)
AWS Distro for OpenTelemetry (ADOT)
X-Ray and CloudWatch provide their own X-Ray SDK and CloudWatch Agent to collect traces, metrics and logs. AWS has however introduced the AWS Distro for OpenTelemetry (ADOT), which implements the OpenTelemetry APIs for recording metrics and traces from your applications. ADOT lets us use the Java auto-instrumentation Agent and agents of other languages as well as the vendor independent OpenTelemetry API for collecting custom traces and metrics. Therefore, it avoids the need to implement the X-Ray or Cloudwatch specific APIs or agents because it will internally forward the OpenTelemetry data to X-Ray and Cloudwatch. This capability enables us to use X-Ray and CloudWatch to store and inspect the collected data while ingesting the data using OpenTelemetry.
An ADOT setup is illustrated by the following diagram in Figure 6. The ADOT agent and collector implementations are based on their open-source counterparts from OpenTelemetry but extend them with the AWS specific integrations to forward the data to X-Ray and Cloudwatch. The ADOT agent is deployed in every monitored application instance, while the collector may be deployed on AWS computing platforms and Docker/Kubernetes. The ADOT collector implementation will transform OpenTelemetry traces to the X-Ray data format, transform OpenTelemetry metrics to a CloudWatch data format and by default export these to X-Ray and CloudWatch. Note that for sending metrics, the ADOT collector uses the CloudWatch PutLogEvents API, not the metrics APIs, but wraps its metrics in EMF, the embedded metrics format, from which CloudWatch reads the contained metrics.
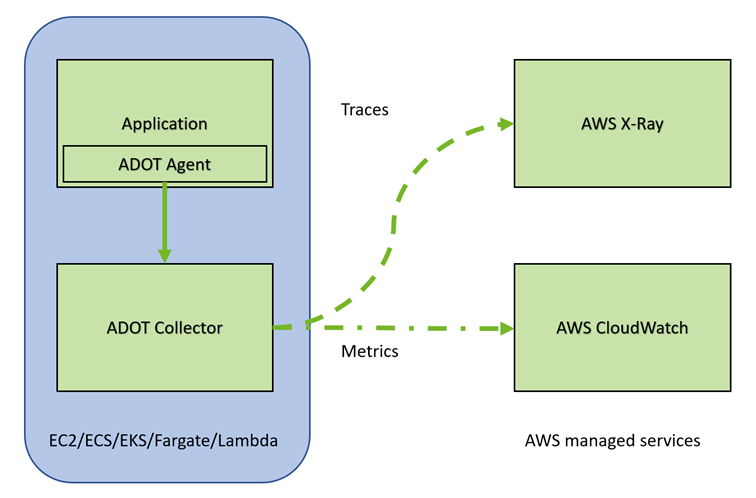
Figure 6.: ADOT integration with X-Ray and CloudWatch
Deploying AWS Distro for OpenTelemetry with a Java application on AWS
To use ADOT, the java agent must be installed in the application’s java process and an ADOT collector must be deployed and reachable from the agent.
Agent
The agent releases are available here. An agent is installed into the Java process using the -javaagent JVM parameter. To later identify your application’s traces, also define the service.name and service.namespace values in the OTEL_RESOURCE_ATTRIBUTES environment variable:
By default, this agent will export data to an OpenTelemetry collector reachable at http://localhost:4317. Since the ADOT Java auto-instrumentation agent is a wrapper around the OpenTelemetry implementation, the standard OpenTelemetry agent configurations can be used. For example, if you want to only randomly sample 10% of the traces and send the collected data to a different endpoint, the following environment variables must be set for the instrumented application:
OTEL_TRACES_SAMPLER configures what sample method is used and OTEL_TRACES_SAMPLER_ARG defines arguments for the chosen sample method, if supported. In the case a trace ratio up to 100% may be chosen by setting a floating-point number <= 1.0. For the ADOT agent, the property OTEL_EXPORTER_OTLP_ENDPOINT defaults to http://localhost:4317, where an OTEL collector is expected, but it may be overwritten to send data to a Collector on a different host/port.
By default, automatically collected Otel metrics are sent to the same endpoint as configured with OTEL_EXPORTER_OTLP_ENDPOINT, since the collector ingests both the traces and metrics. Apart from some OpenTelemetry instrumentation metrics, the automatically collected metrics of the Java auto-instrumentation monitor Java runtime state like heap areas and garbage collection time. while functional metrics like the number of calls to application endpoints have to be implemented manually. These auto-metrics may be also deactivated using the following environment property:
OTEL_INSTRUMENTATION_RUNTIME_METRICS_ENABLED=false
Collector
The ADOT collector supports the AWS computing platforms Amazon Elastic Compute Cloud (EC2), Amazon Elastic Container Service (ECS), and Amazon Elastic Kubernetes Service (EKS) on EC2, AWS Fargate, and AWS Lambda, as well as on, -premises (see documentation). Examples for the specific deployments are available in its documentation. It will automatically forward the OpenTelemetry traces to X-Ray and metrics to CloudWatch, unless configured otherwise.
When setting up a collector, you must decide whether you want to use the same collector for multiple application instances or only for one. The decision which way you take should be mainly influenced by the scaling strategy of your application. If your instance count is predictable and doesn’t vary a lot a static set of collectors might be sufficient. If your instance count is very dynamic and varies a lot, you need to think about scaling your collectors along with your application instances. For very dynamic environments it might be easier to run a small collector for each instance as a sidecar and scale it along with the application than setting up heuristics on the number of collectors required and adjust load balancers between the application and the collectors. However, the downside of the sidecar deployment is that the collector consumes a percentage of the applications resources.
In the following Listing 1, an example Kubernetes deployment file with the ADOT collector as a sidecar for such highly dynamic deployments is shown (source: Github repo, fill in AWS region and cluster_name of the EKS cluster). Please note that the resources settings in the example are chosen conservatively and must be adjusted according to the load on the collector instance. Beyond that, an IAM policy to grant rights to push data to X-Ray/CloudWatch and an IAM role attached to the worker nodes is required, you can find more details about the required settings here. Beyond the configuration shown in Listing 1, an IAM policy to grant rights to push data to X-Ray/CloudWatch and an IAM role attached to the worker nodes is required (refer to the documentation).
Listing 1: Collector deployed as sidecar
Pricing
Using the ADOT components does not cost anything by itself apart from the resources used for deploying and running the ADOT collector. X-Ray and CloudWatch are services managed by AWS and have a usage-based pricing model depending on the AWS location, paid monthly. To estimate your expected cost, use the AWS pricing calculator for X-Ray and CloudWatch: https://calculator.aws/#/ Here we’ll discuss an example for a hypothetical X-Ray and CloudWatch usage at the time of writing in Europe (Frankfurt, eu-central-1).
X-Ray
X-Ray bills the recording of traces as well as scanning and the retrieval of recorded traces when querying traces. It offers a “Perpetual Free Tier” – the first 100k traces recorded each month and the first 1 mio. traces retrieved or scanned each month are free of cost. Additional charges depend on the AWS region of the application. Exact billing information is documented on the X-Ray pricing page, but for illustration purposes, let’s look at the cost for an exemplary application, where AWS states the following cost (at the time of writing):
- “Beyond the free tier, traces recorded cost $5.00 per 1 million traces recorded ($0.000005 per trace).
- Beyond the free tier, traces retrieved cost $0.50 per 1 million traces retrieved ($0.0000005 per trace).
- Beyond the free tier, traces scanned cost $0.50 per 1 million traces scanned ($0.0000005 per trace).”
As a rule of thumb, one request to a traced application will result in one trace. An application with an average 1,000 requests per minute, running 24/7 for one month of 30 days with a sampling rate of 100% (100% of the traces are recorded) will incur a cost of 215.50$ per month for trace storage (43.2 million. traces minus free tier):
(1,000 * 60 * 24 * 30 – 100,000) * $0.000005 = $215.50
Assuming 100 requests to retrieve traces per day, each scanning two hours of traces and each retrieving 100 full traces will cost 29.65$ per month (2 million scans, 300k retrievals minus free tier):
((100 * 2 * 10,000 * 30) + (100 * 100 * 30) – 1,000,0000) * $0.0000005 = $29.65
Depending on your application, this example may represent a full production load and would cost on average $245.15 per month. The cost will decrease with lower load on the application or with a lower sampling rate, while it will increase with higher load.
CloudWatch
CloudWatch offers a wider array of billed functions, including monitoring of AWS resources that a project may already be using, dashboards alarms. metrics API usage and log ingestion. Therefore, actual cost may vary greatly depending on usage. It is advisable to use the AWS pricing calculator for a reliable estimation. Note that the use of the embedded metrics format by the ADOT collector incurs charges for log ingestion and archival as well as custom metrics. CloudWatch offers a free tier as well and won’t incur any cost while this tier isn’t exceeded. 5GB of logs are free to ingest and archive. In addition to the storage cost, each custom metric will have an additional cost.Custom Metrics are prorated by the hour and only metered while they are being send. The charges are:
- “First 10,000 metrics: $0.30
- Next 240,000 metrics: $0.10
- Next 750,000 metrics: $0.05
- Over 1,000,000 metrics: $0.02”
Logs:
- “Collect (Data Ingestion): $0.63 per GB
- Store (Archival): $0.0324 per GB
- Analyze (Logs Insights queries): $0.0063 per GB of data scanned”
The following example lists the cost an application would incur, that sends 20 custom metrics from 10 instances24/7 during a month of 30 days and also sends 1GB of log volume per day. Assuming the logs are compressed to 6GB for archiving, the monthly cost would be as follows:
20 metrics * 10 instances = 200 metrics * $0.30 = $60
1GB logs * 30 days – 5GB free tier = 25 GB * $0.63 = $15.75
6GB logs archived – 5GB free tier = 1GB * $0.03 = $0.03
This volume of logs with embedded metrics would result in charges of $75.78 per month.
All billed services and listed costs were taken at the time of writing for the region eu-cental-1. As they may be subject to change however, please always refer to the current cost listed on the AWS pricing page for X-Ray and CloudWatch.
Pricing Considerations
Using the AWS managed services X-Ray and CloudWatch has a cost. You can alternatively build a setup using opensource tools like Jaeger, Zipkin and Prometheus with OpenTelemetry to achieve similar insights without paying for the tools themselves. Keep in mind however, that the operation and maintenance of these components also comes at a cost, as they require knowledge, time, and resources.
If further functionality is required, commercial APM and Observability solutions like Dynatrace, AppDynamics, NewRelic or DataDog are available, albeit at a price. That said, all aforementioned providers offer support for ADOT and OTEL, enabling you to integrate them with an existing ADOT or OTEL setup, should they be introduced later.
Conclusion
Due to the availability of the Java auto instrumentation agent and easy configuration, the AWS Distro for OpenTelemetry provides an efficient way to make an application deployed on AWS observable by collecting traces and metrics without having modify code and without having to maintain an extensive stack of observability solutions yourself. It integrates per default with the AWS solutions X-Ray and CloudWatch for storing and inspecting traces and metrics. At the same time, it uses the vendor neutral OpenTelemetry API, allowing for flexible integration with other solutions that offer OpenTelemetry support. Should you deploy an application on AWS, the AWS Distro for OpenTelemetry is a capable option, to gain observability of your application.
GCP and Azure have also introduced support for OpenTelemetry, which we will discuss in upcoming blogposts.