Open Source APM Tool Overview – Jaeger
This article continues our series of blog posts about the Open Source APM standards and tools we started with Open Source Application Performance Monitoring (APM) Tools – A Classification and Overview of Tools and Standards, providing an overview of the tools and standard. After looking at the two OpenSource APM standards OpenCensus and OpenTracing, we will now introduce Jaeger, an APM tool supporting OpenTracing. We'll provide an basic overview of Jaeger's architecture, introduce UI and show how a Java application can be instrumented to record spans and send them to the Jaeger backend.
| Quick Facts (2019/04/26) | |
|---|---|
| Release | Published to Github in 2016 |
| License | Apache 2.0 |
| Popularity | 91 Contributors, 7,850 GitHub Stars |
| Supported Languages | Go, Java, Node.js, Python, C++, C# |
| Supported Standards | OpenTracing |
| Integration Capabilities | Cassandra, Elasticsearch, Kafka |
Introduction
A tool for tracing transactions through distributed systems, Jaeger is developed by Uber Engineering and written in Go [https://www.jaegertracing.io/]. It was inspired by Google's Dapper, derived from Zipkin [https://eng.uber.com/distributed-tracing/] and first published on Github in 2016 [https://github.com/jaegertracing].
Jaeger supports the OpenTracing API for creating spans and traces and uses the OpenTracing data model. A Jaeger setup is composed of clients deployed in one or more services for tracing their transactions and forwarding the traces, backend components for collecting and storing traces and an UI for inspecting the stored traces. It also provides metrics about its components in the Prometheus format. At the time of writing, clients are available for the languages Go, Java, Node.js, Python, C++ and C#.
Architecture
In order to trace transactions through an application using Jaeger, the application must include a Jaeger client of the respective language. The Jaeger clients implement the OpenTracing API [https://opentracing.io/guides/] and may be used to manually create spans around units of work in an application. Alternatively, the Jaeger client can be used by means of instrumentation libraries, which instrument an application to automatically create spans around requests to or from the application without manual adaption. The Jaeger client handles context propagation between remote calls and reports its traces to a Jaeger agent over UDP. The Agent batches spans and sends them to the Jaeger collector. As a result, the routing and discovery of the collector is abstracted away from the client into the agent, which is intended to be deployed on the same host as the instrumented application. Jaeger's backend consists of the collector, a storage solution and the Jaeger-UI. The collector stores the reported spans which can then be queried by the jaeger-query component, which hosts the UI to display the spans. Three storage solutions are supported by the Jaeger collector: Cassandra, ElasticSearch and Kafka. For Kafka, an ingester is available as additional component, which reads from Kafka topics and writes the data to the storage backends (Cassandra/Elasticsearch).
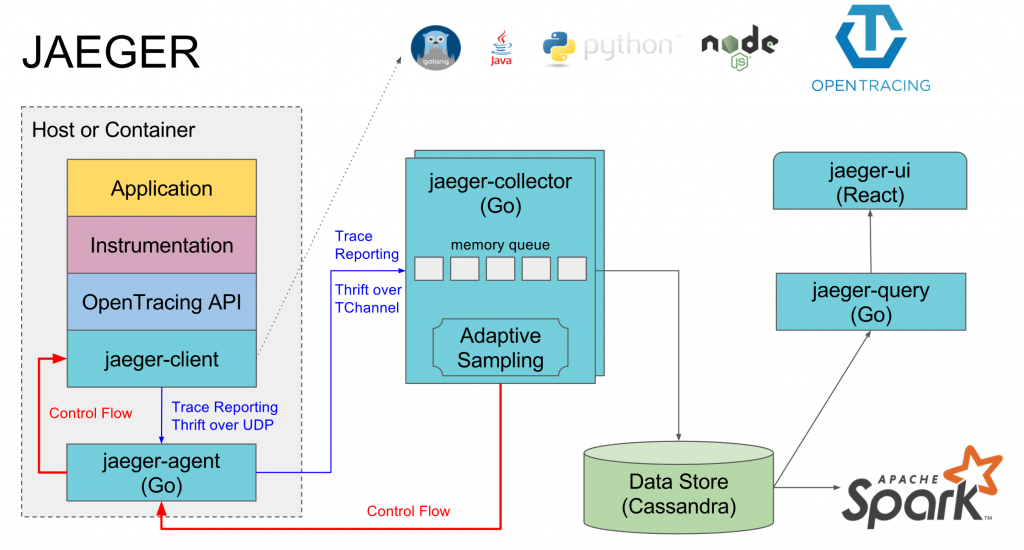
Source: https://www.jaegertracing.io/docs/1.11/architecture/
or production use, Jager supports an adaptive sampling strategy to cope with varying load. The Jaeger collector is capable of initiating a change of sampling strategy at the Jaeger agent. By default however, traces are sampled at a rate of 0.1%.
Zipkin compatibility
Jaeger was derived from Zipkin and retains backwards compatibility for an application sending spans in Zipkin formats (Thrift or JSON) over HTTP. Therefore an application instrumented using Zipkin can be reconfigured to send its spans to a Jaeger backend.
Running Jaeger
Productive deployment
Jaeger's backend components are distributed as Docker images through Docker Hub:
| Component | Repository |
|---|---|
| jaeger-agent | hub.docker.com/r/jaegertracing/jaeger-agent/ |
| jaeger-collector | hub.docker.com/r/jaegertracing/jaeger-collector/ |
| jaeger-query | hub.docker.com/r/jaegertracing/jaeger-query/ |
| jaeger-ingester | hub.docker.com/r/jaegertracing/jaeger-ingester/ |
There are also orchestration templates available for:
- Kubernetes: github.com/jaegertracing/jaeger-kubernetes,
- OpenShift: github.com/jaegertracing/jaeger-openshift.
For a detailed description of the configuration options, refer to the Jaeger documentation: https://www.jaegertracing.io/docs/1.11/deployment/
Locally
Quick local testing is made possible by the "all-in-one" Docker image [https://hub.docker.com/r/jaegertracing/all-in-one]. It includes the Jaeger agent, collector, query and UI components together with an in-memory-storage for storing the collected traces. The all-in-one image may be launched with the following command:
docker run -d --name jaeger -e COLLECTOR_ZIPKIN_HTTP_PORT=9411 -p 5775:5775/udp -p 6831:6831/udp -p 6832:6832/udp -p 5778:5778 -p 16686:16686 -p 14268:14268 -p 9411:9411 jaegertracing/all-in-one:1.11
This command runs a Docker container called "jaeger" from an image and exposes the following ports of the container to equivalent ports on the host running Docker.
| Port | Component and function |
| 5775 | agent port: accept zipkin.thrift over compact thrift protocol |
| 6831 | agent port: accept jaeger.thrift over compact thrift protocol |
| 6832 | agent port: accept jaeger.thrift over binary thrift protocol |
| 5778 | agent port: serve configs & sampling strategies |
| 16686 | query port: /api/* endpoints and UI at / |
| 14268 | collector: alternatively accept spans directly from clients instead of through the agent |
| 9411 | collector: Accept Zipkin spans in JSON or Thrift |
After the all-in-one image was downloaded and the container created and deployed, the Jaeger UI is available at http://localhost:16686.
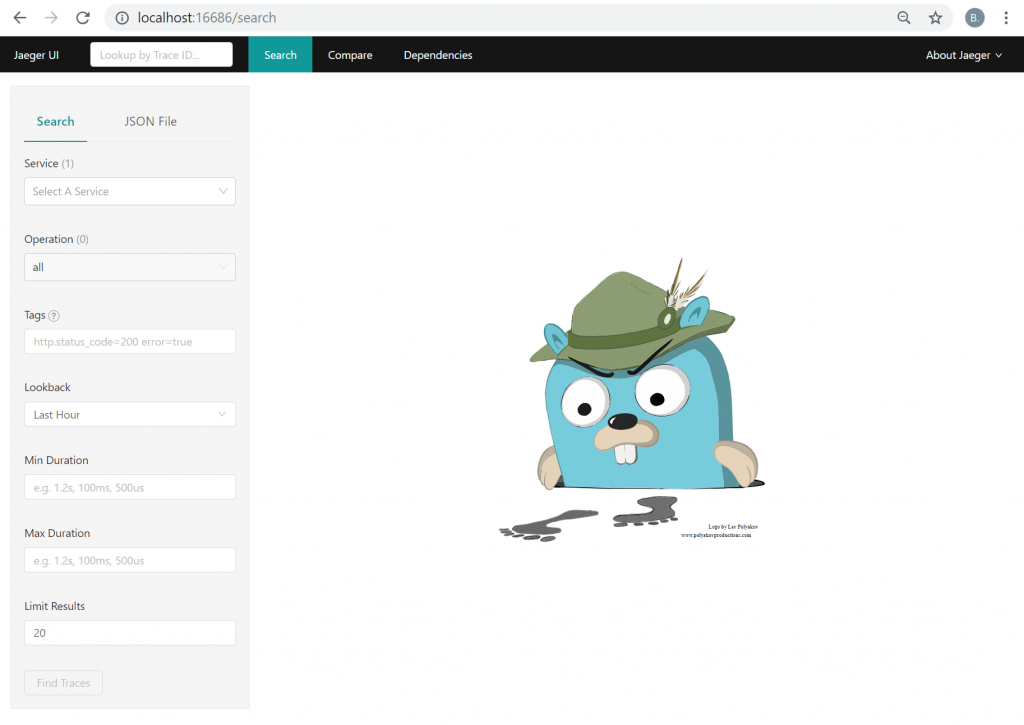
The horizontal navigation bar offers three views.
- Search: This is the primary view of the UI, used for finding and inspecting traces.
- Compare: Two individual traces may be compared in this view.
- Dependencies: Here, a graph showing the number of messages between traced applications is rendered, which may be used for architectural discovery.
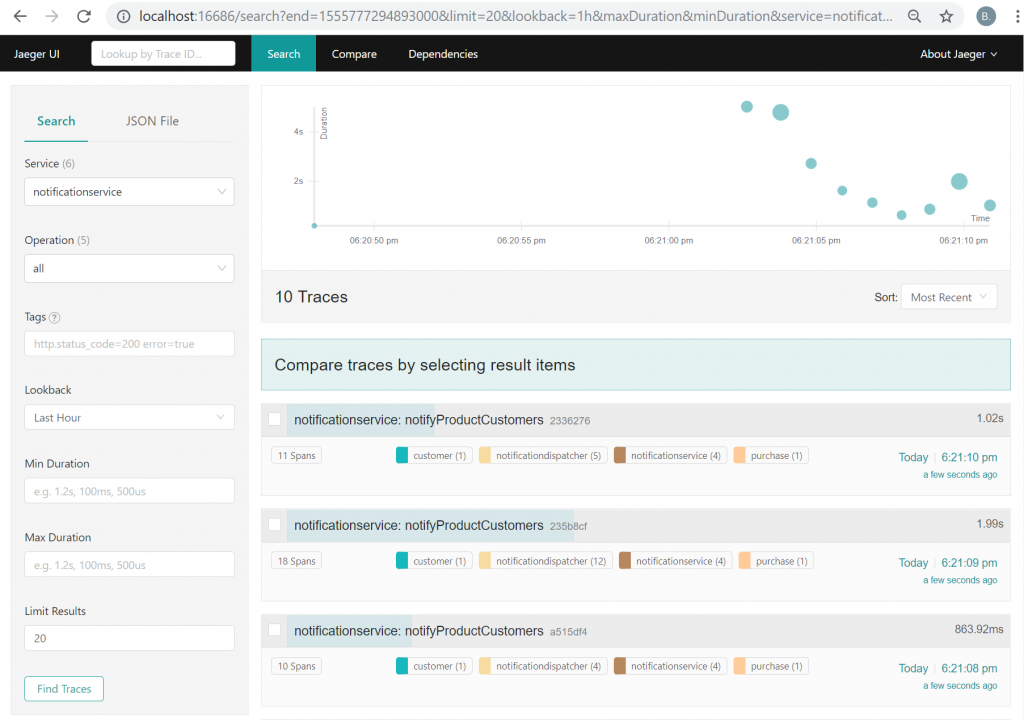
At this point, only "jaeger-query" Service is selectable in the "Search" view's left side "Search" panel, since it is self-monitored. Once more instrumented applications are deployed and send traces, more services become available for selection and corresponding traces are found and displayed. On the top, a distribution diagram renders the duration of the found traces over the searched timeframe, while at the center an ordered list of found traces is displayed. Its items show the service and trace name, the trace ID and duration, as well as how many spans of which service are involved.
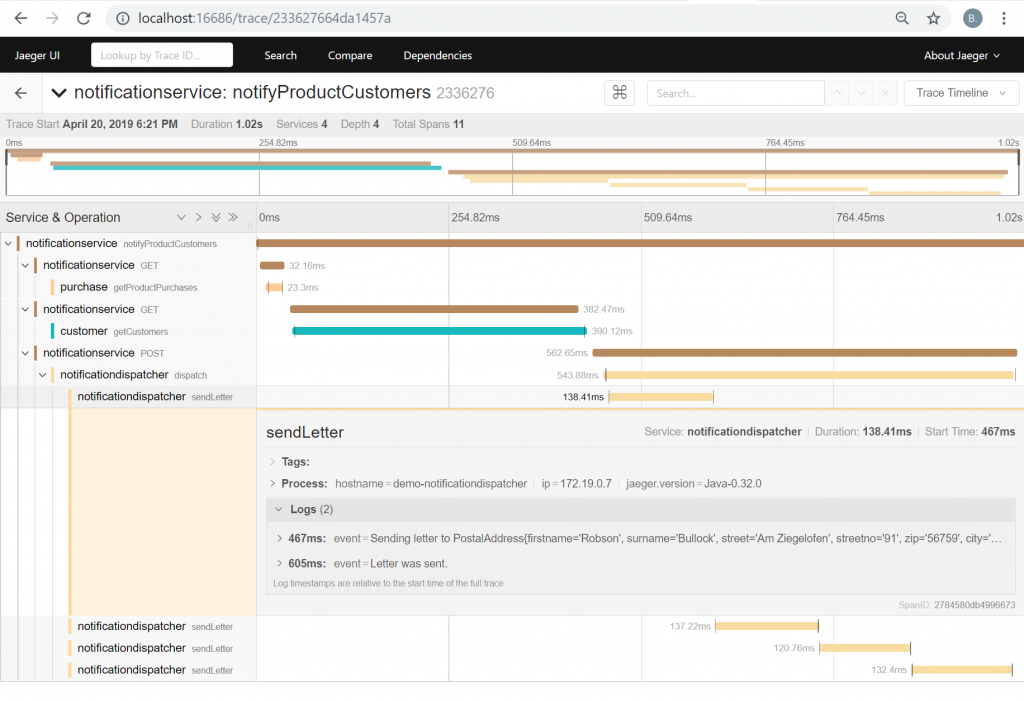
Clicking on any of the traces leads to a detailed view of the trace's timeline, where the individual spans may be inspected. This view can be used to analyze the temporal relations of the spans and potentially identify and locate performance issues. It also displays logs and tags that were written as part of the spans, which are part of the OpenTracing data model.
Instrumenting a Java application with Jaeger
Instrumenting an application with Jaeger requires the Jaeger agent for the respective language as dependency. For a Java project built using Maven, the jaeger-client has to be added via the following dependency:
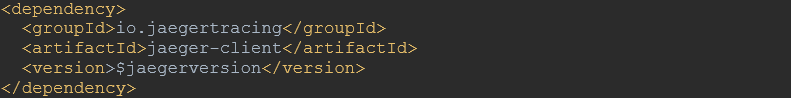
At the time of writing, Jaeger's most recent release version is 0.34.0.
In order to collect traces, a Tracer has to be initialized. It is the actual implementation that records spans and sends them to an agent. Rather than always creating a new Tracer object, it may be registered as GlobalTracer, which must only be done once in the application's lifecycle. The GlobalTracer is a helper class, implementing the Tracer interface, that forwards all calls to the underlying Tracer object.
import io.jaegertracing.Configuration;
import io.opentracing.Scope;
import io.opentracing.Tracer;
import io.opentracing.util.GlobalTracer;

public class JaegerTracingDemo {

    public static void main(String[] args)
…
Any method may then use the tracer to create spans. The Scope objects act as containers of the currently active Span and implement the Closable interface for finishing the spans.
private static void doSomething()
More details on the use of the OpenTracing API in Java is available in the respective documentation: https://opentracing.io/guides/java/
Automatic instrumentation for Spring (Boot) applications
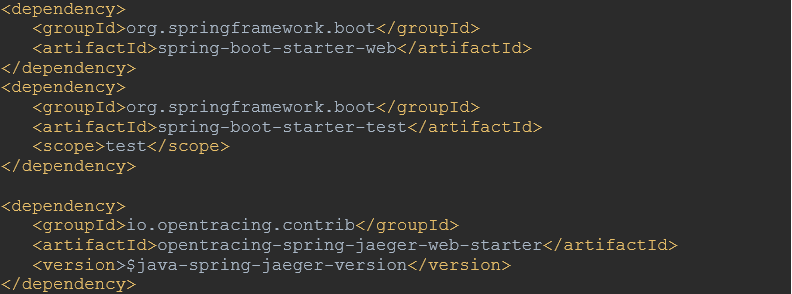
It is not always necessary to manually instrument an application using the OpenTracing API, since auto-instrumentation libraries may be available, as is the case for Spring Boot. The "Java-Spring-Jaeger" contribution to OpenTracing [https://github.com/opentracing-contrib/java-spring-jaeger] provides starters for automatically tracing outgoing and incoming web requests with Jaeger.
In order to instrument a Spring Boot application, the "opentracing-spring-jaeger-web-starter" has to be added as dependency (lates Java Jaeger Spring release version at the time of writing: 1.0.3):
The application.properties file must contain at least the following configuration:
spring.application.name=theservicenname

opentracing.jaeger.udp-sender.host=localhost
opentracing.jaeger.udp-sender.port=6831
This configuration is already sufficient for creating traces for all incoming and outgoing REST requests and sending them to a Jaeger agent listening to localhost:6831 for traces via UDP. If any manual tracing is required however, an io.opentracint.Tracer object may be injected into a Bean using the @Autowired annotation. Using the injected tracer object, spans can be created manually according to the standard OpenTracing API.
import io.opentracing.Tracer;
…

@RestController
public class ARestController {

    @Autowired
    RestTemplate restTemplate;

    @Autowired
    Tracer tracer;
...