The three pillars of observability are traces, metrics, and logs. OpenTelemetry is an open-source observability framework, which offers APIs and tools to standardize the collection of telemetry data from running, potentially distributed applications. In two previous blog post, we discussed the architecture of OpenTelemetry and showed how AWS integrates OpenTelemetry into their X-Ray and CloudWatch services, as well as how GCP realizes the integration of OpenTelemetry into its Cloud Operation Suite. This post will explore how Microsoft Azure integrates OpenTelemetry into Azure Monitor to collect and inspect traces and metrics from an application deployed on-premises or on arbitrary cloud environments, without the need to deploy additional tools. We will show the necessary configuration to get started and look at the cost of using Azure Monitor.
Azure Monitor
Azure Monitor is a managed solution for “collecting, analyzing, and acting on telemetry from your cloud and on-premises environments”. It is comprised of several tools to gain insights into applications, containers, VMs, logs etc. Among those tools are “Application Insights and “Azure Monitor Metrics”, which Azure integrates with OpenTelemetry to store traces and metrics.
Application Insights
Application Insights is a part of Azure Monitor providing APM (application performance management) capabilities. Among other features like monitoring request rates, response times and failure rates and alerting when a degradation is recognized, it stores and visualizes traces. To send telemetry data to Application Insights, it is necessary to instrument an application with an agent or use an SDK to collect custom telemetry data. This telemetry is also the basis for the applications’ metrics. Figure 1 and 2 show views from Applications Insights. The performance analysis view, providing performance statistics over various request types and the transaction diagnostics view, which renders the trace of a single transaction.
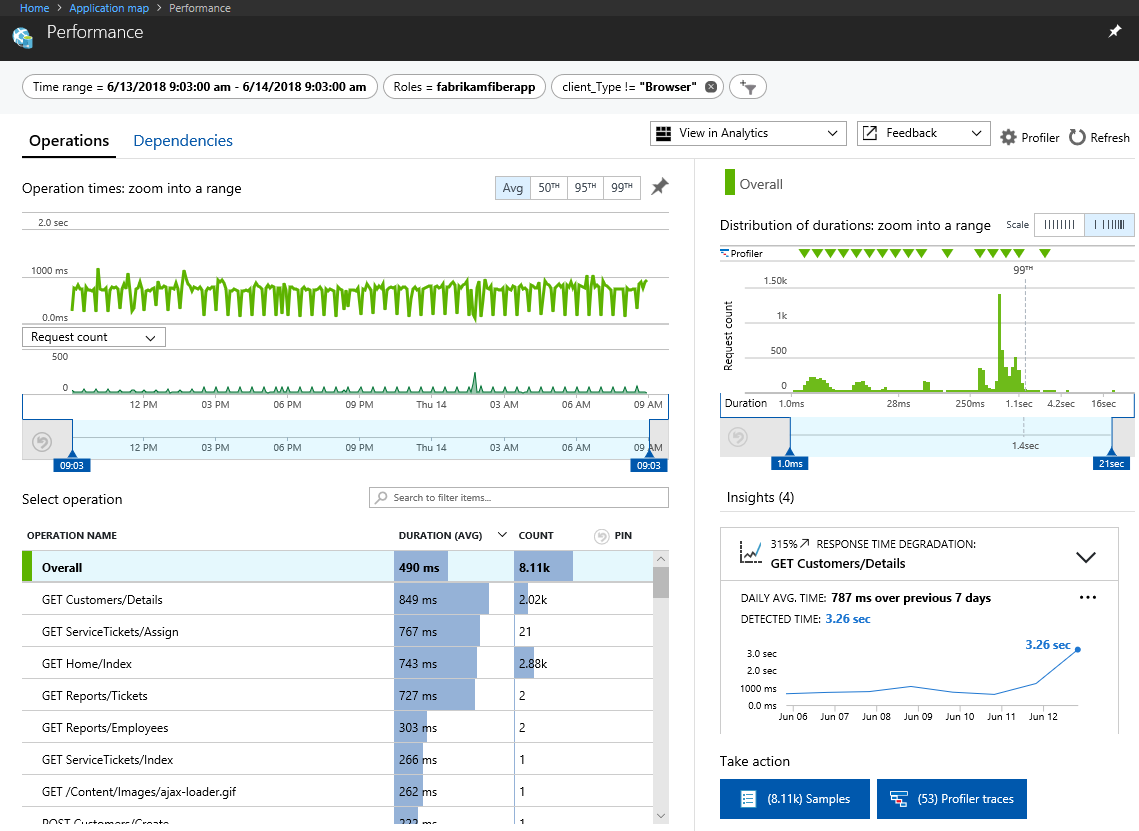
Figure 1: Application Insights performance analysis view (Source: https://docs.microsoft.com/en-us/azure/azure-monitor/app/app-map?tabs=net#investigate-performance)
Figure 2: The Application Insights transaction diagnostics view (1: Transaction 2: TBD? 3: Selected calls’ details 4: Other transaction search results) (Source: https://docs.microsoft.com/en-us/azure/azure-monitor/app/transaction-diagnostics#transaction-diagnostics-experience )
Azure Monitor Metrics
Azure Monitor Metrics collects numeric data from monitored resources into a time series DB and offers means to visualize, analyze, create dashboards, and generate alerts on these metrics. Metrics are automatically collected for Azure resources or VMs and will be collected from Application Insights for monitored applications. Beyond those automatically collected metrics, it’s possible to collect custom metrics using the Application Insights SDK.
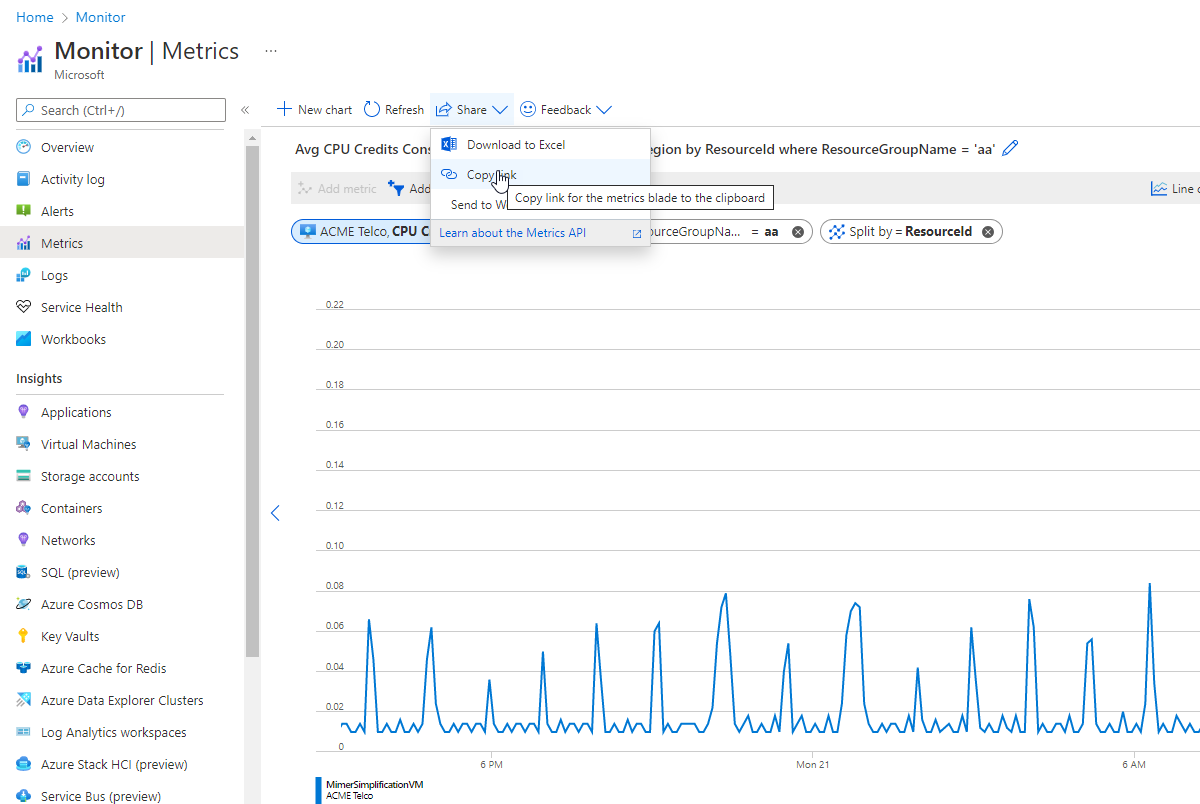
Figure 3: Azure Monitor Metrics Diagram (Source: https://docs.microsoft.com/en-us/azure/azure-monitor/essentials/metrics-getting-started)
Integration of OpenTelemetry into Azure Monitor
The integration of OpenTelemetry into Azure Monitor for applications differs in features by the supported language. While Java support is based on the OTEL Java-auto-instrumentation agent, .NET, Python and Javascript have (preview) manual instrumentation packages. To automatically instrument a Java application and start collecting traces and metrics, the Java Agent must be configured into the Java runtime. Figure 4 illustrates this integration from an architectural perspective. This is the officially documented approach, therefore the remainder of this post refers to it. There is however an alternative that leverages the vanilla OTEL Java auto-instrumentation agent, which we will briefly discuss in the following section.
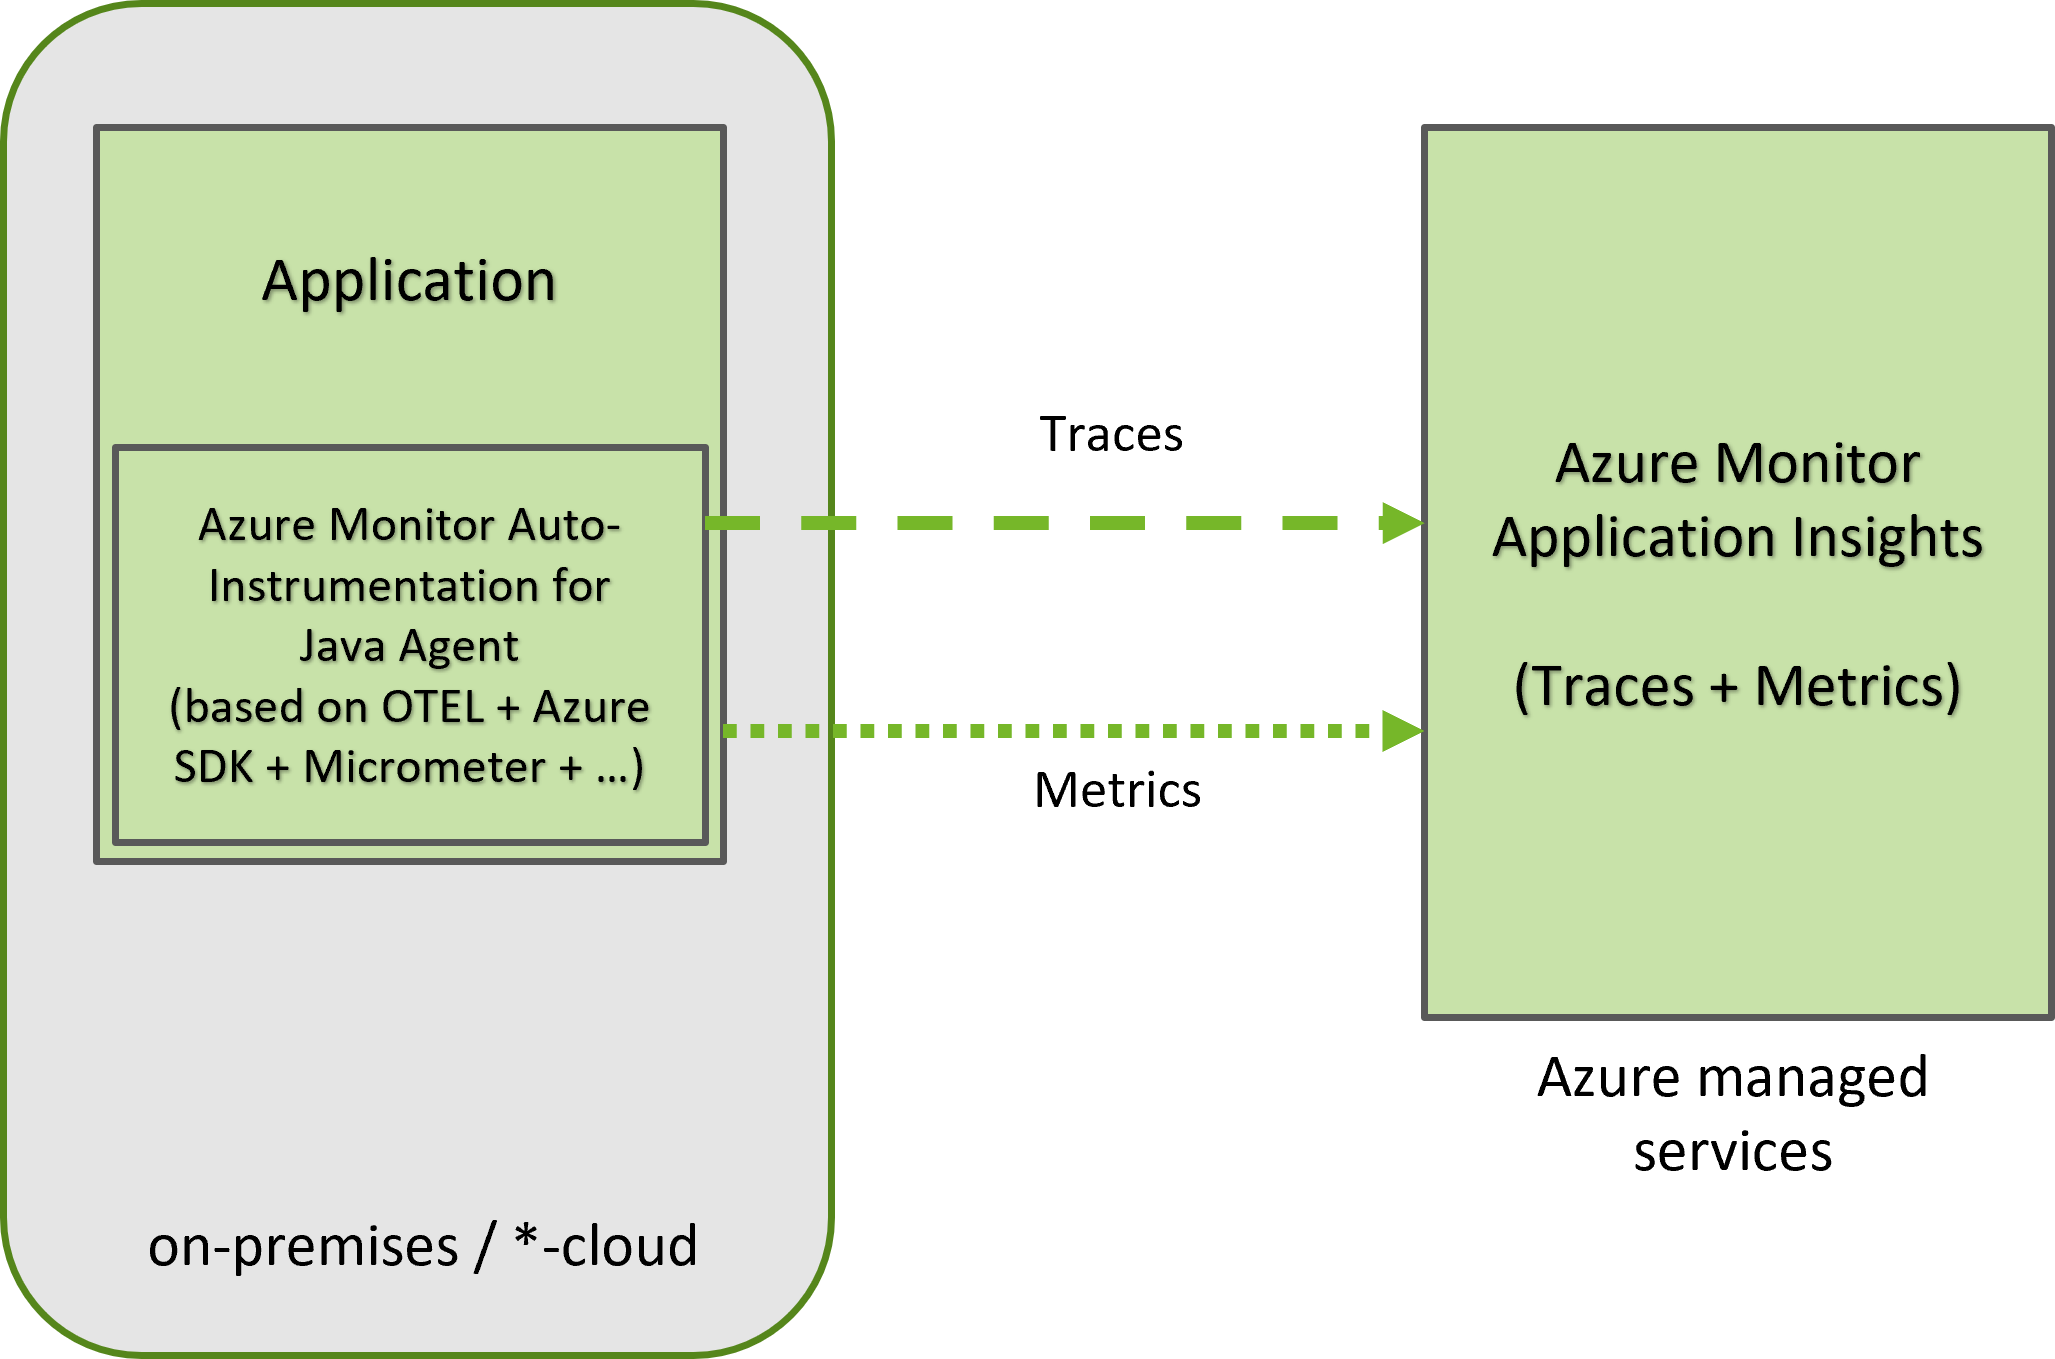
Figure 4: Architecture of the OpenTelemetry integration into Azure Monitor
OTEL Collector based approach of sending traces to Azure Monitor
The official approach for sending telemetry data to Azure Monitor uses the Azure monitoring agent and directly transmits the collected data to the Azure endpoint as shown in in figure 4 (“direct export”). OpenTelemetry’s base components, however, also support the export of metrics using the OTLP (OpenTelemetry Protocol) to an OTEL Collector, which can be configured to forward the telemetry data to a variety of endpoints. Using this approach, it’s possible to deploy the completely vendor neutral OpenTelemetry Java auto-instrumentation agent in a Java application and let it forward the collected traces and metrics to an OTEL collector. Using the (at the time of writing unsupported) Azure Monitor exporter for the OTEL Collector, the collector may transform traces and logs to the Azure Monitor format and forward them to Azure Monitor, as shown in figure 5. Note that the “azuremonitorexporter” extension of the OTEL Collector currently only supports transforming and forwarding of OTEL traces and logs and can therefore not send the collected metrics to Azure Monitor. It’s however possible to configure multiple exporters in the OTEL collector and e.g., export the metrics collected by the OTEL auto-instrumentation agent to a Prometheus server. Figure 5 illustrates the deployment of a collector next to the application, which may be done using e.g., a sidecar or separate process on the same host as the application. But it is just as well possible to deploy a central collector on a different host instead.
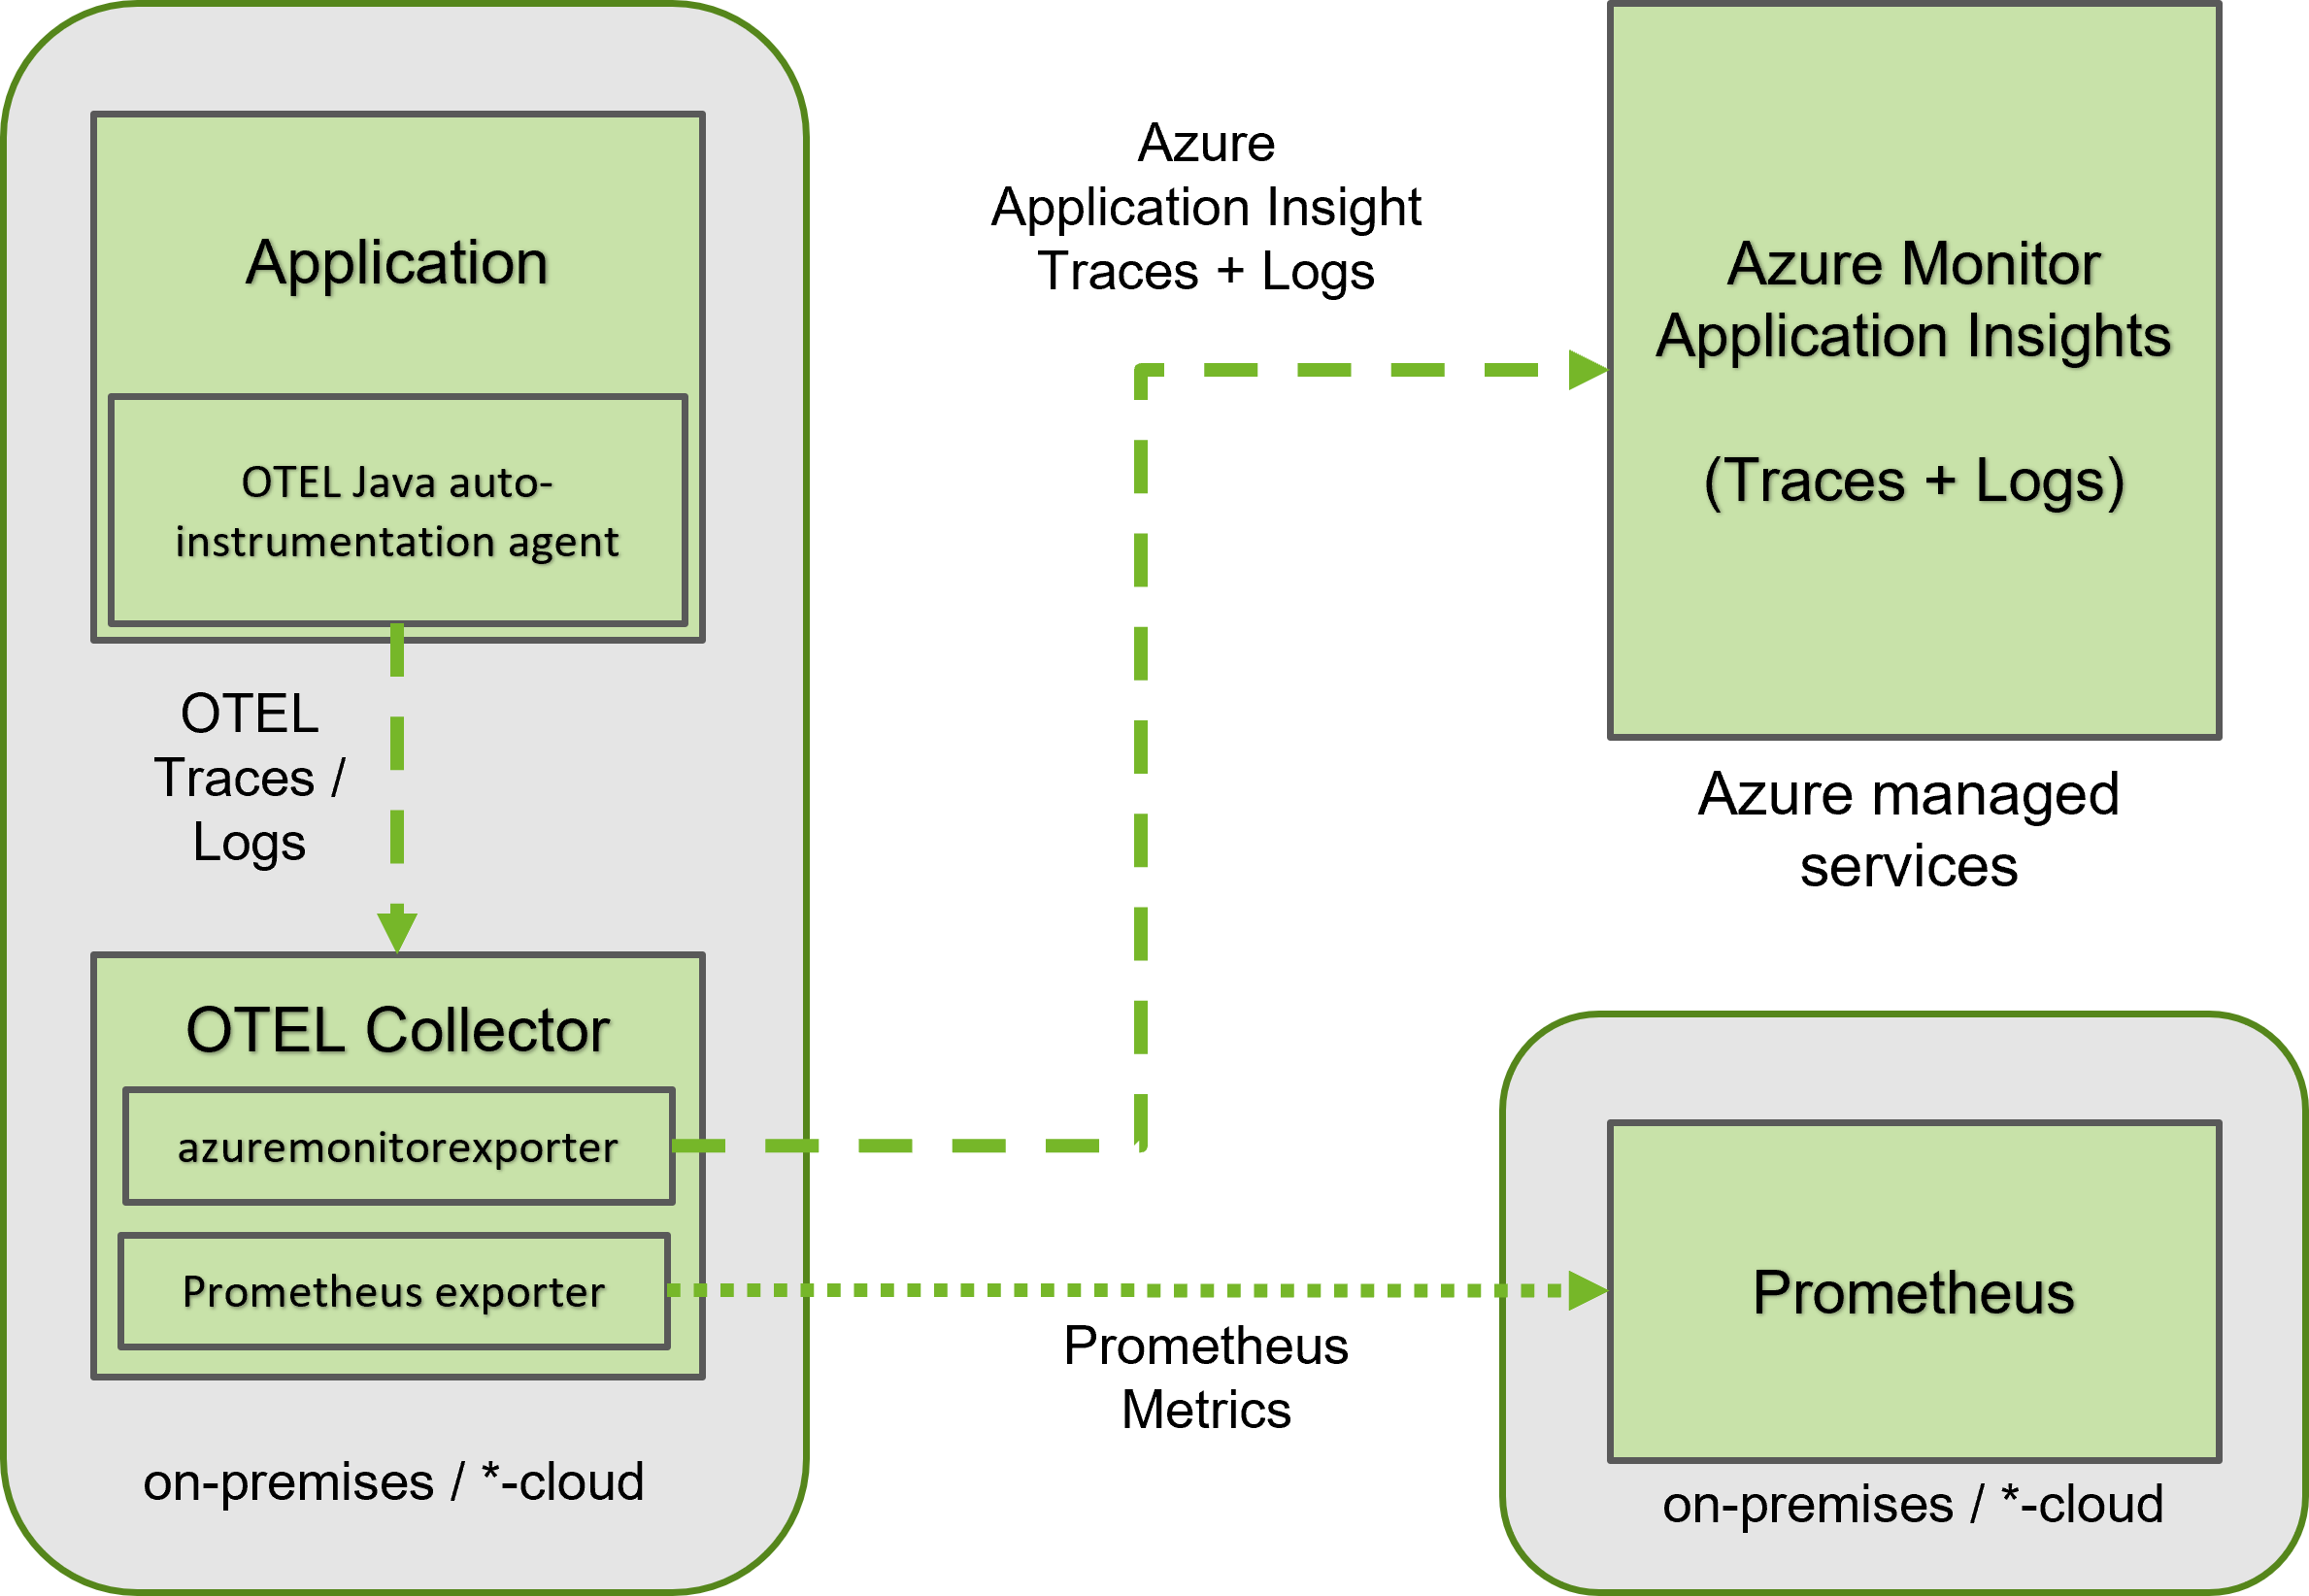
Figure 5: Using an exporter with the OTEL Collector to send telemetry to Azure Monitor
Collecting traces and metrics in Azure Monitor using OpenTelemetry
We will only show the official approach of using the Application Insights agent to forward telemetry to Azure Monitor there. For a Collector based setup, please refer to the OTEL Collector documentation and the documentation of the Azure Monitoring Exporter.
To use Application Insights, an Azure subscription is required and an Application Insights resource must be created. Once these prerequisites are provided, traces and metrics may automatically be collected from a Java application using the Java Application Insights agent. It must be added to the Java process, using the -javaagent parameter:
java -javaagent:path/to/applicationinsights-agent-3.2.11.jar -jar myapp.jar
Additionally, the application Insights connection String must be available as env variable to the agent (alternative: use a config file):
APPLICATIONINSIGHTS_CONNECTION_STRING =
Within a few minutes, the data should be visible in the Application Insights Resource Tab:
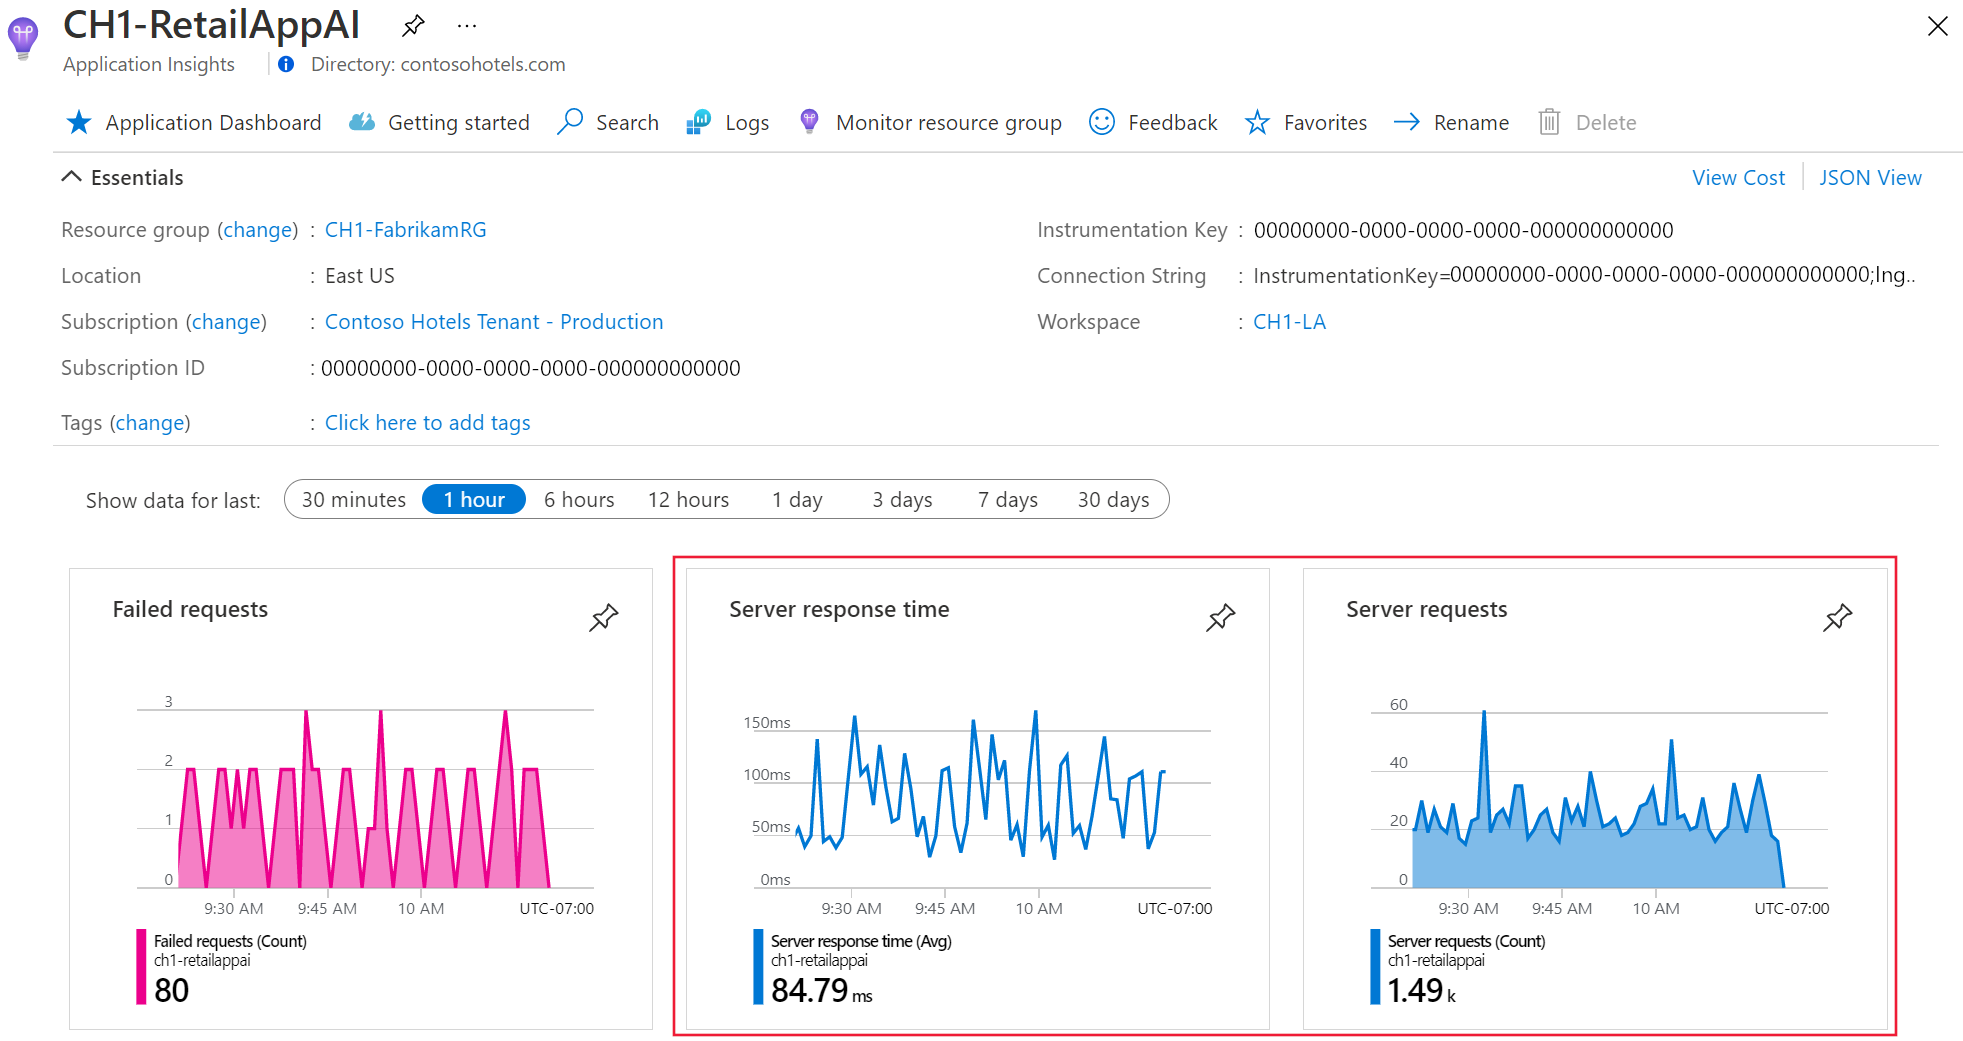
Figure 6: Collected Telemetry (Source: https://docs.microsoft.com/en-us/azure/azure-monitor/app/java-in-process-agent#confirm-data-is-flowing)
At the time of writing, the following entrypoints and calls are automatically instrumented:
Autocollected entrypoints (“requests”):
- JMS consumers
- Kafka consumers
- Netty/WebFlux
- Servlets
- Spring scheduling
Autocollected external requests + downstream distributed trace propagation (“dependencies”):
- Apache HttpClient
- Apache HttpAsyncClient
- AsyncHttpClient
- Google HttpClient
- gRPC
- net.HttpURLConnection
- Java 11 HttpClient
- JAX-RS client
- Jetty HttpClient
- JMS
- Kafka
- Netty client
- OkHttp
Metrics and logs are also automatically collected, but metrics are based on Micrometer.
The collection of custom traces and metrics is also possible, but the Application Insights Agent only supports the OTEL API for “Dependencies, Requests and Exceptions”. These conform to spans. Collecting custom metrics requires use of Micrometer or the Azure Insights SDK.
Recording custom Traces using OTEL API
To record custom traces in an application instrumented with the Application Insights Agent, the dependencies shown in Listing 1 are required.
Listing 1: Dependencies to record custom OTEL spans
An example method that is traced with its own span, records events in the span as well as an exception might look as shown in Listing 2.
Listing 2: Collecting custom spans using the OTEL API
The @WithSpan annotation records a new span in the context of the current trace or starts a trace with a span. Using Span.current(), we can obtain a reference to the active span of the current context and record custom attributes and events, as well as exceptions.
When adding the customTraceMethod() to an endpoint of a demo application instrumented using the Application Insights Agent, the collected telemetry looks as shown in the Application Insights transaction overview displayed in Figure 7 and in the corresponding timeline of the transaction displayed in figure 8.
Figure 7: Telemetry of a transaction with the custom Span, Events and Exception
Figure 8: Timeline of a transaction with custom span
Cost of Azure Monitor
Azure Monitor is a managed service provided by Microsoft and billed based on usage and region. Refer to the Azure Monitor pricing page for the most up to date cost in each region. For an estimation based on your expected usage, refer to the pricing calculator. For testing the services it’s possible to create a free account.
Billing in Azure Monitor for application insights is based on ingested log volume and there are two pricing models to choose from: pay-as-you-go and commitment tiers, as shown in figure 7, which contains an extract from the pricing page in the “Germany West Central” region at the time of writing. The former incurs a constant cost per ingested GB of data, while the latter has a constant price per day and allows for ingestion up to its tier’s limit. Ingested data beyond this limit is billed per GB as shown in figure 9.
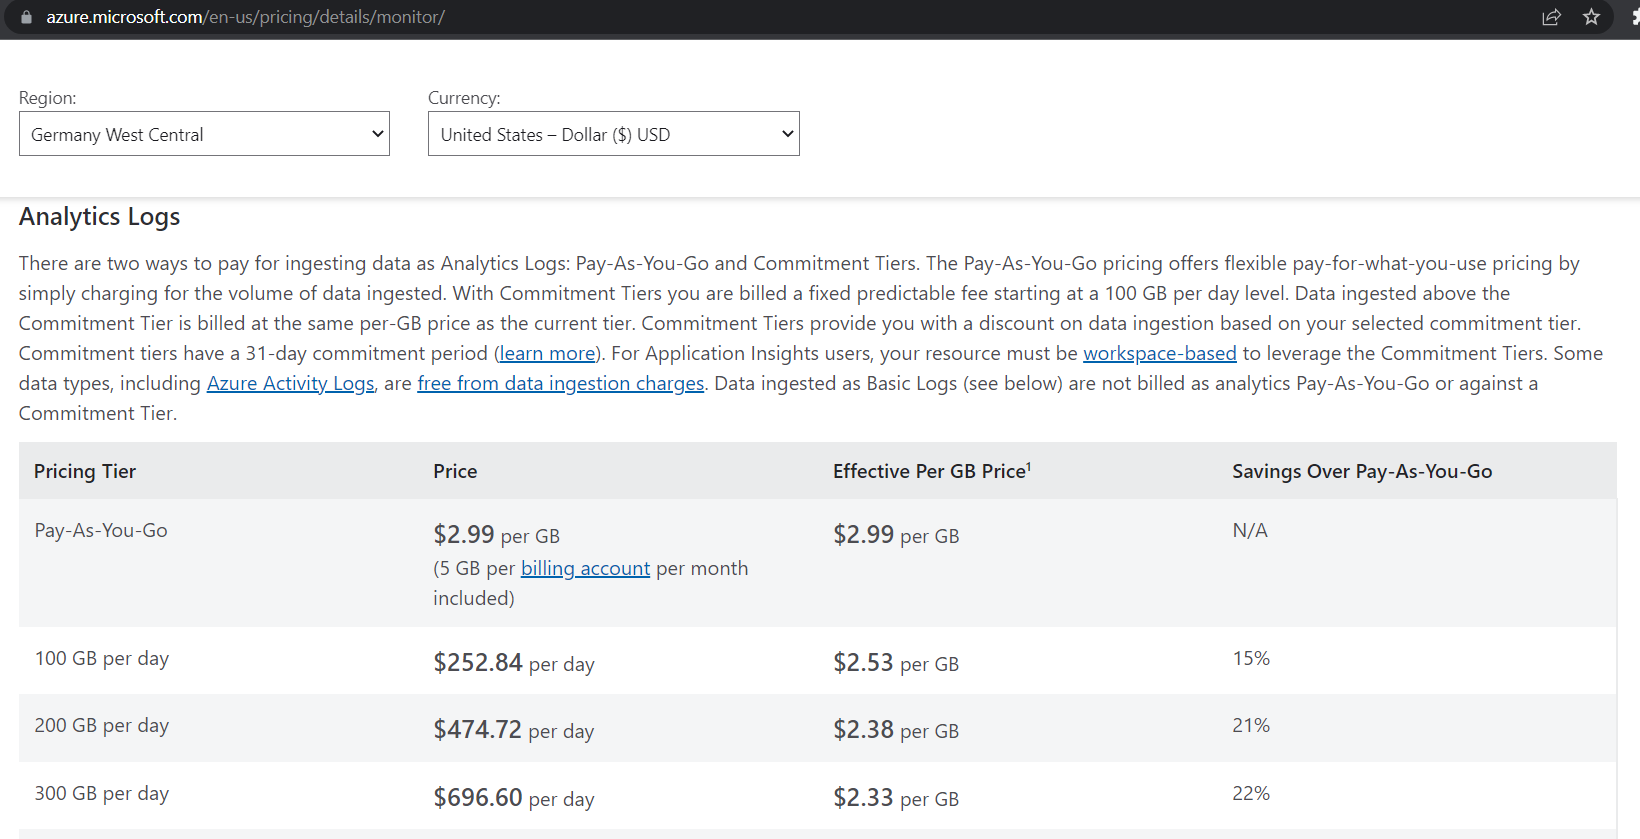
Figure 9: Extract from Azure Monitor pricing page for Application Insights logs
The billing based in ingested data volume renders it more difficult to predict the exact expected cost for the telemetry of an application under a specific load compared to billing methods based on trace or span counts. The pricing calculator also calculates the cost based on the data volume. Therefor observing the telemetry data volume of an application under test conditions is advisable to be able to project the actual requirements for productive loads. At 1GB of data ingestion per day and a default retention period of 3 months, a bill of 89.70$ is to be expected, according to the pricing calculator shown in the Screenshot of figure 10.
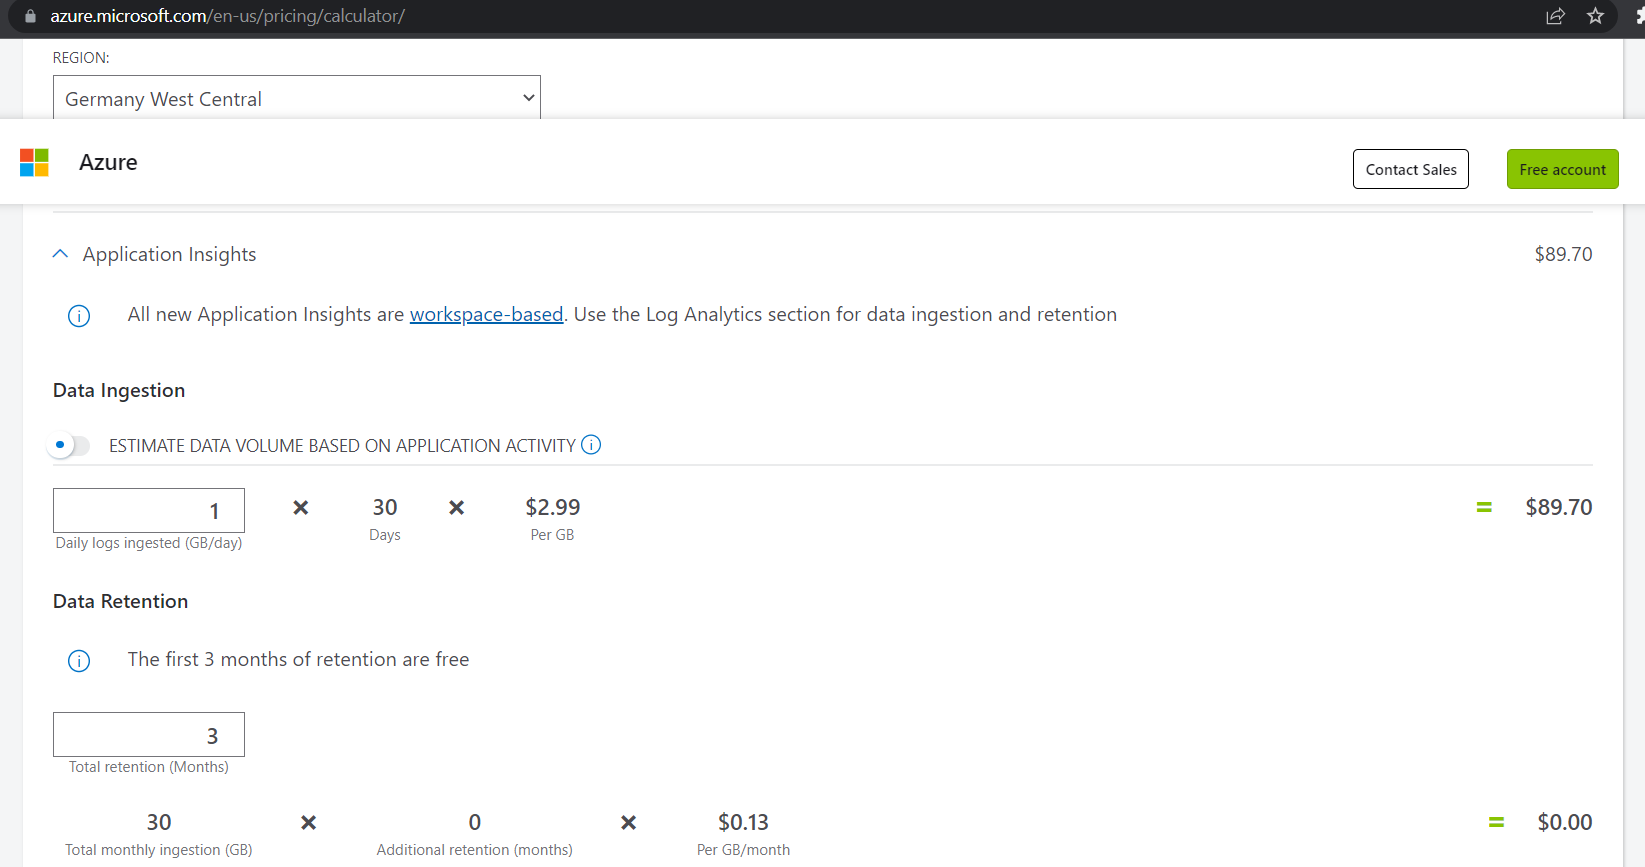
Figure 10: Pricing Calculator screenshot
Standard metrics are currently free, while custom metrics (which can currently not be collected using OTEL) are billed based on data size in MB, as shown in Figure 11.
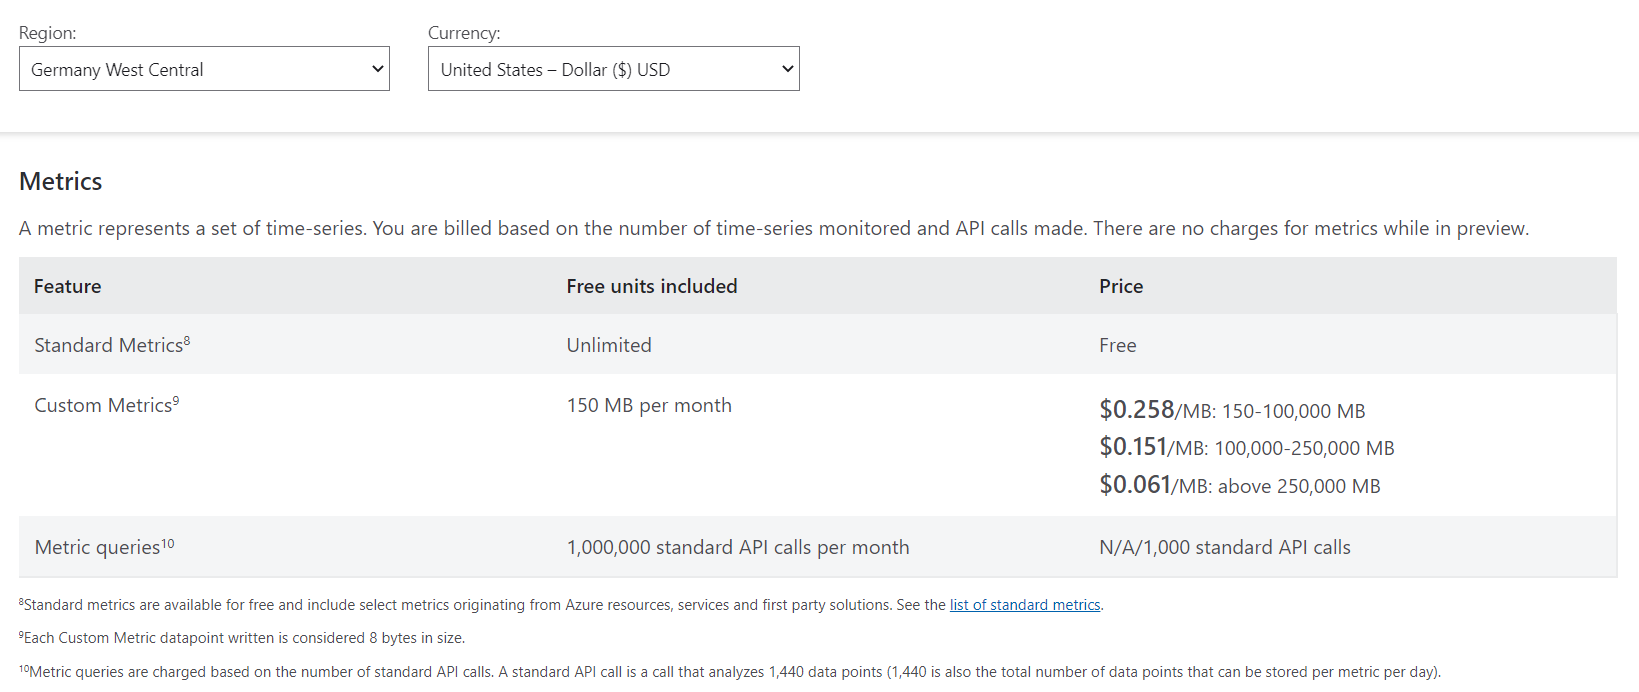
Figure 11: Extract from Azure Monitor pricing page for metrics
The incurred cost for using the managed Azure Monitor services to ingest and process telemetry data must be considered when deciding whether to use Azure Monitor to store and process telemetry data, either through the official approach leveraging the Application Insights Agent for Java, or through the OTEL-Collector based approach. This cost must be weighed against using an alternative stack of open-source or commercial tools for observability, that offers means to store, inspect, and process traces and metrics. For a cost, Azure Monitor offers an easy to set up observability solution for a Java application based on OpenTelemetry, that can leverage the automatic instrumentation capabilities and vendor neutral OpenTelemetry API to record custom traces.
Conclusion
We’ve shown how Azure integrates OpenTelemetry into Azure Monitor to make Java applications observable using automatic instrumentation, regardless of whether they are deployed on Azure or other cloud or on-premises environments. The availability of an auto-instrumentation agent to collect telemetry data into Azure Monitor makes it possible to quickly gain observability without code adaption, while the usage of OpenTelemetry for recording custom traces ensures vendor neutrality of custom instrumentation code using the OpenTelemetry API.