The three pillars of observability are traces, metrics, and logs. OpenTelemetry is an open-source observability framework, that offers APIs and tools to standardize the collection telemetry data from a running application. In a previous post, we discussed the architecture of OpenTelemetry and showed how AWS integrates OpenTelemetry into their X-Ray and CloudWatch services. This post will explore how Google Cloud Platform (GCP) integrates OpenTelemetry into the Google Cloud Operations Suite to collect and inspect traces and metrics from a GCP deployed application, without the need to deploy additional tools. We will show the necessary configuration to get started and look at the cost of using the Google Cloud Operations Suite.
Google Cloud Operations Suite
The Google Cloud Operations Suite, formerly known as “Stackdriver”, is a set of managed tools that offer features to monitor applications deployed in GCP by collecting and exploring metrics, traces and logs. It offers functionality beyond the scope of this article, but we will focus on those functions relevant to the OpenTelemetry integration.
Cloud Trace
Cloud Trace is part of the Cloud Operations Suite, stores traces, enables users to explore the collected traces and to automatically analyze the stored traces for potential performance bottlenecks. It provides a Trace SDK for java, Node.js, Go and Ruby, which can be used to collect traces from respective applications. Additionally, it offers a Trace API that for retrieving the stored traces programmatically.
Figures 1-3 show the default view of Cloud Trace, which is the entry point for further analysis, the insights view of an individual trace with analysis of application behavior and the trace list view, that lists the recorded traces.
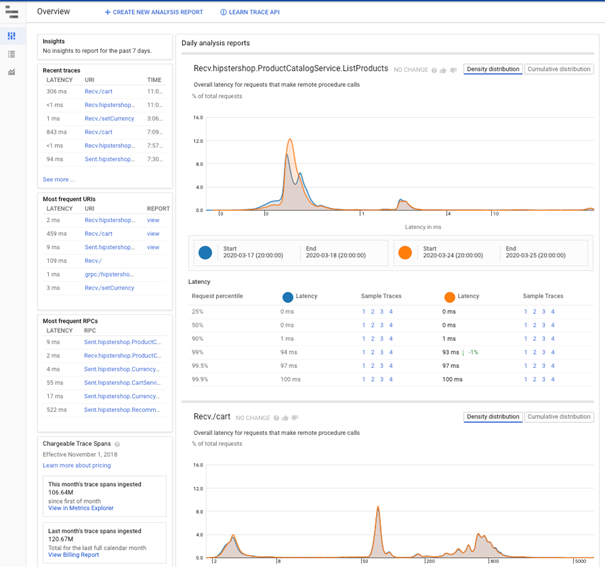
[Figure 1: Default view of Cloud Trace, Source]
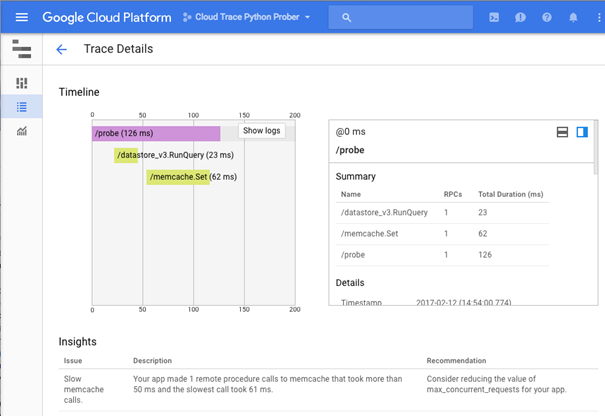
[Figure 2: Insights view, showing potential performance bottlenecks, Source]
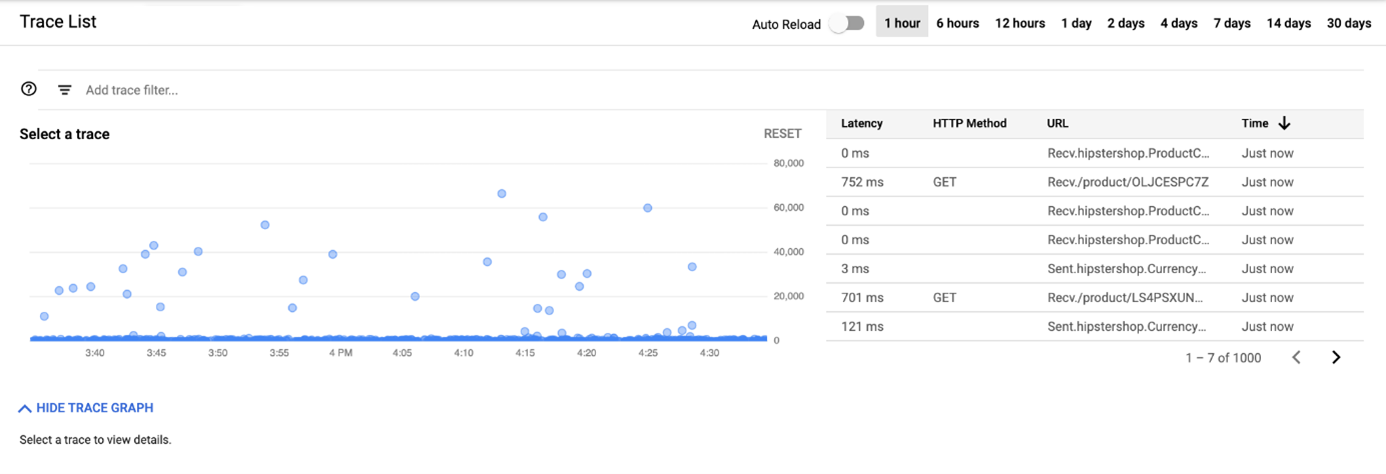
[Figure 3: Trace list view, Source]
Google Cloud Monitoring is a service for monitoring applications and resources in GCP. It can be used to monitor SLAs based on metrics, store and track custom metrics sent from applications (even outside of the GCP), define Dashboards and monitor GCP resources. To send custom metrics from an application, an application usually calls the Cloud Monitoring API via a client library. Figure 4 shows the metrics explorer view, in which all collected metrics can be viewed as graphs.
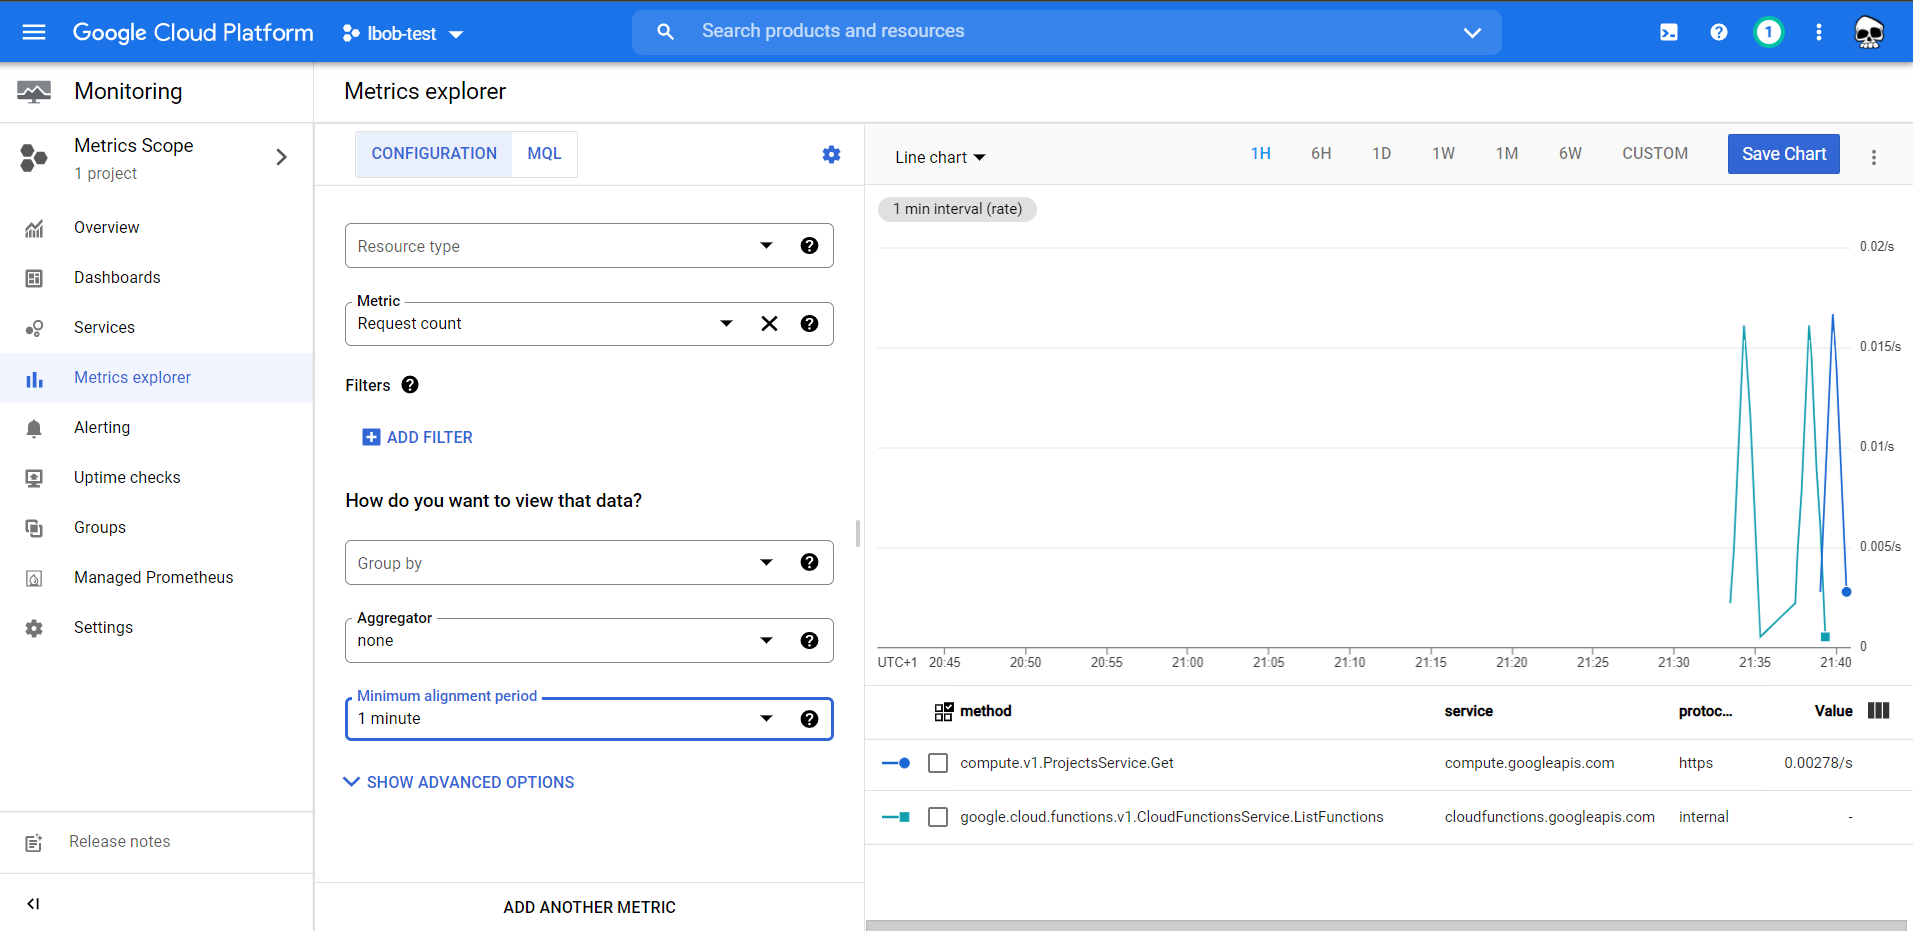
[Figure 4: Metrics explorer of Cloud Monitoring]
Integration of OpenTelemetry with the Cloud Operations Suite
In the last post, we showed that AWS provides the AWS Distribution for OpenTelemetry (ADOT), which encompasses an adapted OpenTelemetry collector and Java auto-instrumentation agent, enabling us to automatically instrument and collect traces from Java applications. GCP’s integration leverages custom exporters for the OTEL SDK, that directly transmit telemetry data to the Cloud Trace and Cloud Monitoring Metrics, as shown in figure 5. This integration however relies on the OTEL SDK to collect custom traces and metrics, which requires code adaptions and does not leverage the OTEL auto-instrumentation agent for Java.
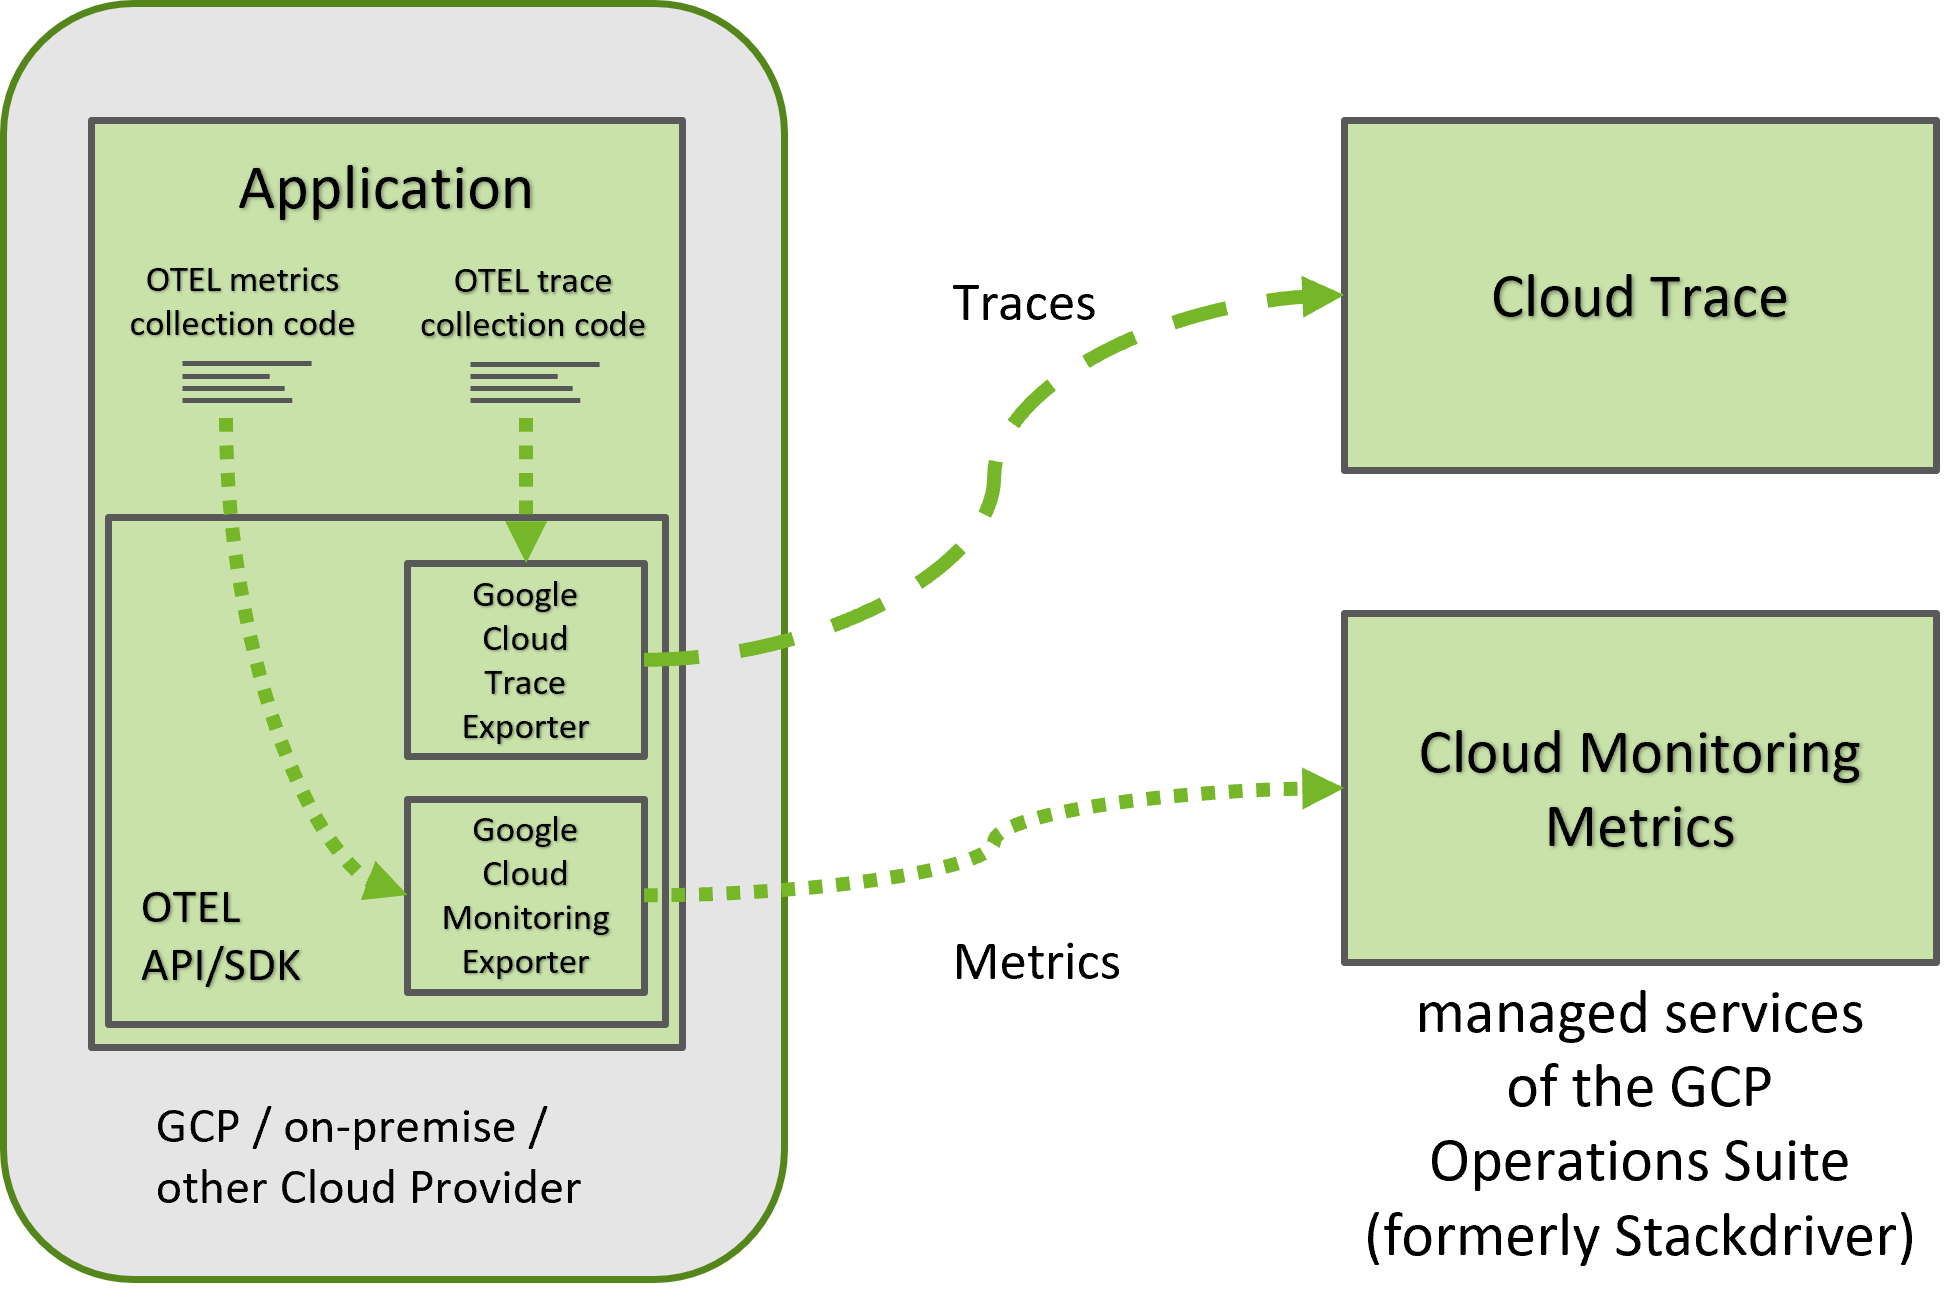
[Figure 5: Exporters to send traces and metrics to Cloud Trace and Cloud Monitoring Metrics]
The Google Cloud Trace Exporter and Google Cloud Monitoring Exporter (at the time of writing in alpha state) implement the OpenTelemetry API for recording traces and metrics and must to be added as dependencies to the application
An exporter for the Otel auto-instrumentation agent for sending auto-collected telemetry to the Cloud Operations Suite is in development, but is still labelled as „proof-of-concept” at the time of writing, since custom exporters in the auto-instrumentation are still subject to regular changes.
Additionally, GCP announced that they are working to implement OpenTelemetry libraries for some of their cloud products out-of-the-box. This integration, once released, promises to extend the distributed OpenTelemetry traces collected from an application via spans that honor the propagated trace ID.
Using the OTEL Auto-Instrumentation with the Zipkin Collector
Besides the integration of custom exporter extensions, the OTEL Java auto-instrumentation agent supports the export of traces in the Zipkin format to a Zipkin Server out of the box. This feature may be used in combination with the Cloud Trace Zipkin Collector, a prepackaged Zipkin server extended and configured to forward traces to Cloud Trace, to leverage the OTEL Java auto-instrumentation and send traces to Cloud Trace. This setup is illustrated in figure 6. Here, the Zipkin collector fulfills a similar role to the ADOT/OTEL Collector in the AWS setup. This workaround can only be applied for traces, since the Zipkin export only supports traces.
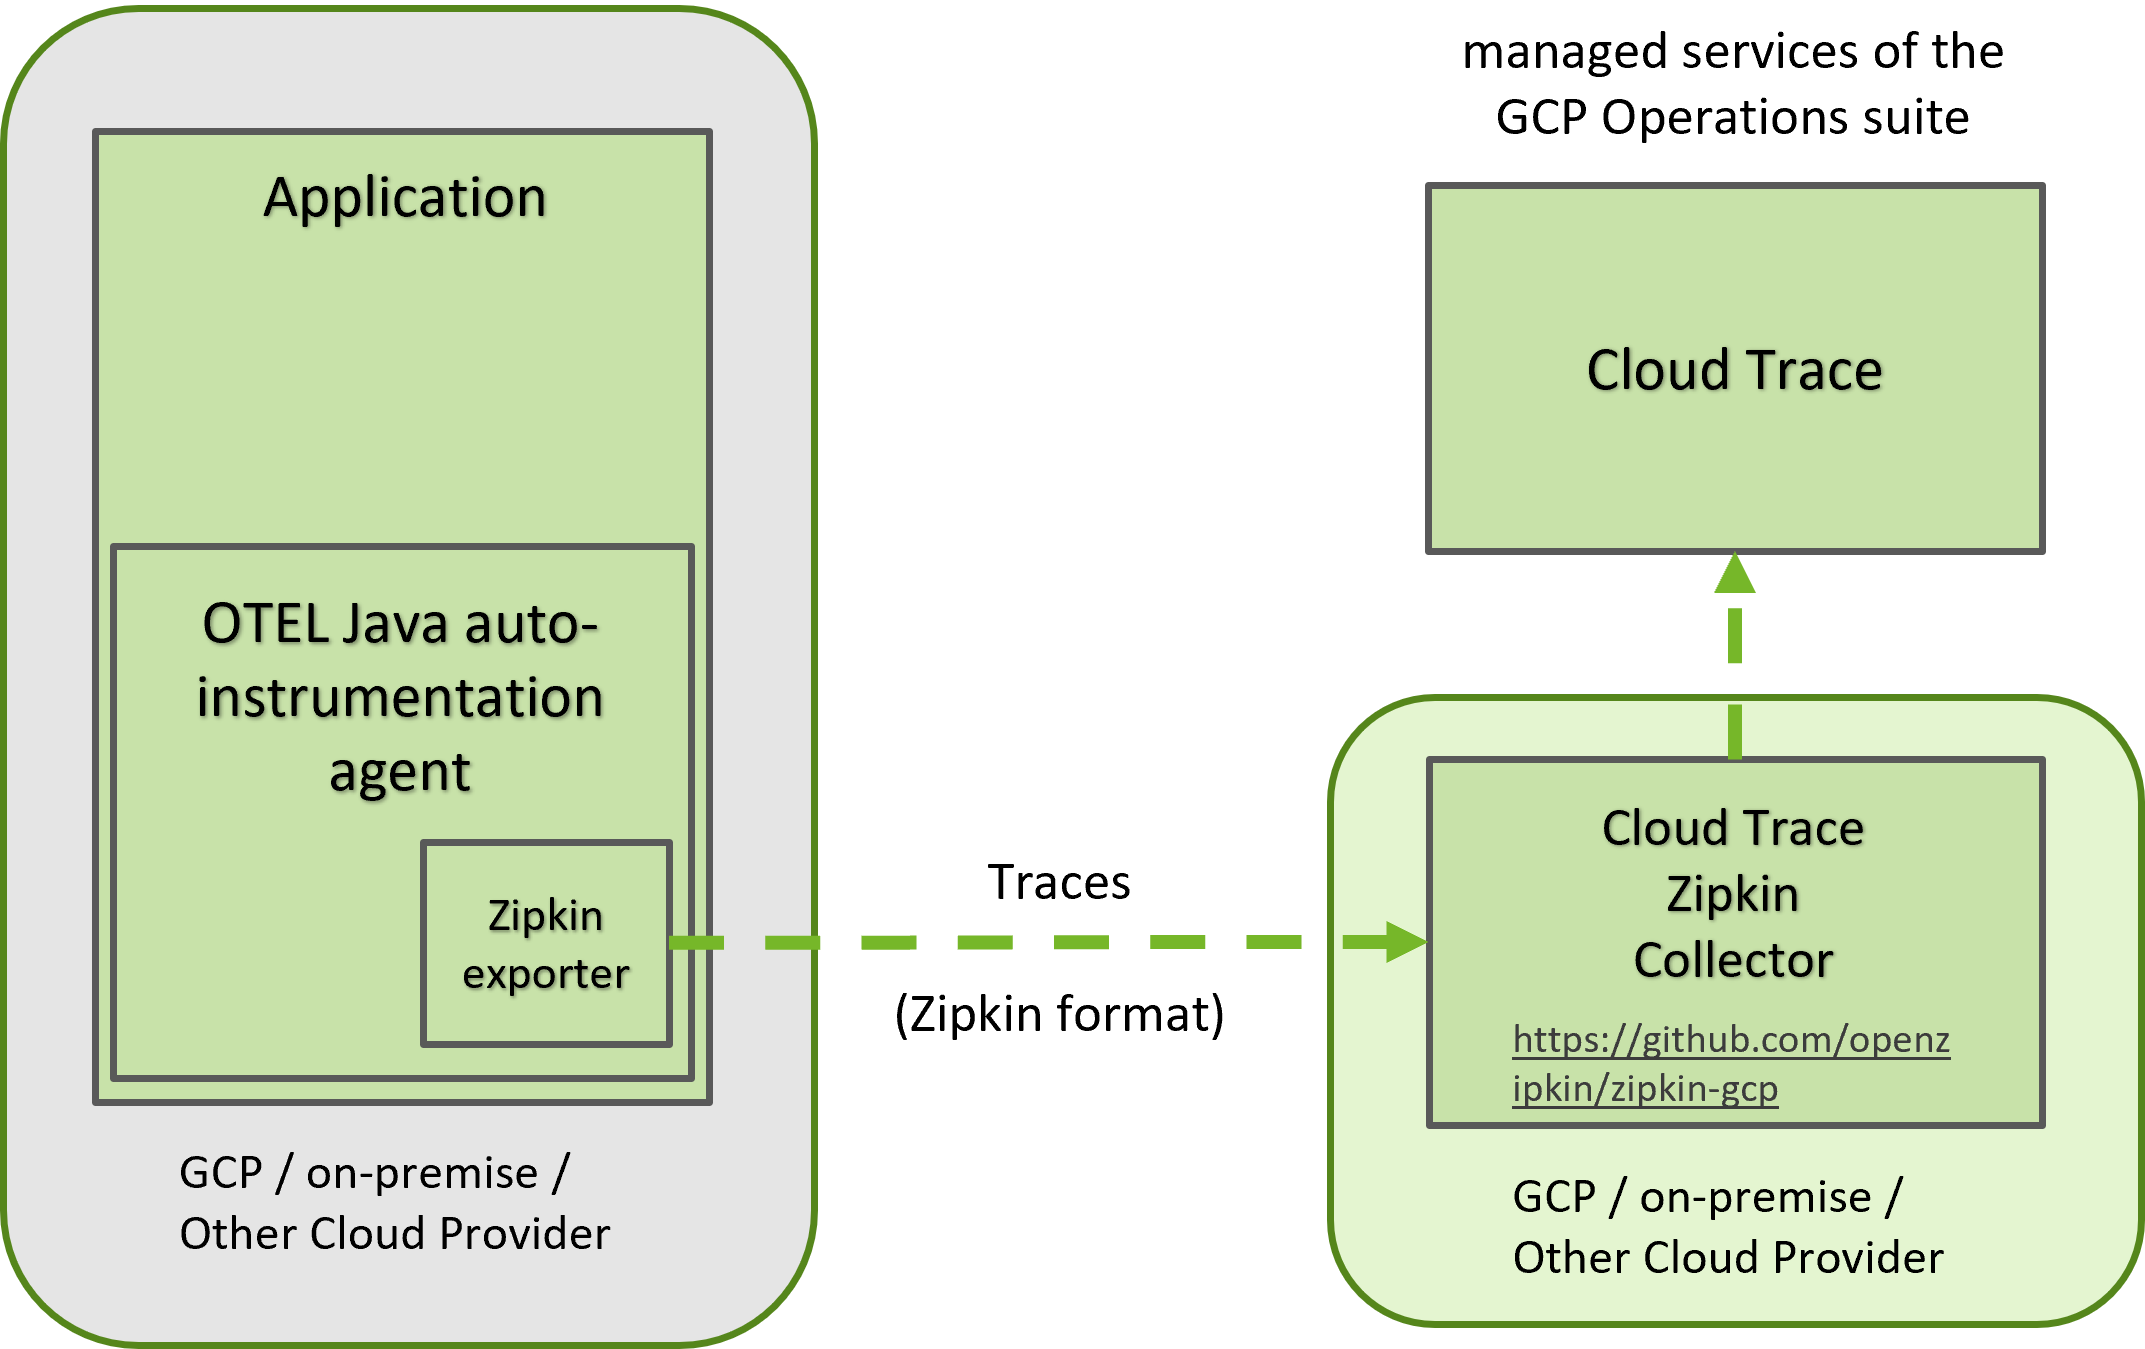
[Figure 6: Leveraging the Zipkin exporter feature and Cloud Trace Zipkin Collector to auto-collect traces]
Collecting Traces and Metrics in GCP with OpenTelemetry
There are several ways to send traces to GCP Cloud Trace, including using the Cloud Trace API manually. The recommended way, however, is to use OpenTelemetry and the respective Cloud Trace library to do so. We’ll provide an overview of the necessary steps to collect traces from a Java application. Similarly, there are multiple ways to send metrics to Cloud Monitoring, however the Metrics Exporter is still in an alpha state and therefore likely subject to change. We will nevertheless show the basic code to collect metrics from a Java application.
Traces
To start collecting traces n GCP, the target GCP project must have the Cloud Trace API activated under the Cloud Console section “APIs and Services”. Additionally, at least Java 8 must be used. To use the tracing API, the OpenTelemetry Java dependencies and the Cloud Trace Exporter must be added to the application. Listing 1 shows the exemplary Gradle dependencies. Check for the most recent version available when including these dependencies!
[Listing 1: Trace dependencies]
Once the dependency is added, a Trace Exporter can be configured, as shown in Listing 2.
[Listing 2: Configuring the TraceExporter to GCP]
Cost of Cloud Trace and Cloud Metrics
Cloud Trace and Cloud Monitoring are managed services provided by GCP and are billed according to usage. Both services offer a free tier, which makes it possible to use try them for smaller uses cases without paying. As the billed functions are subject to change, refer to the Cloud Operations Suite pricing page for the most up to date pricing information. Here, we’ll show how Cloud Trace and Cloud Monitoring metrics are billed and which cost to expect for an exemplary, hypothetical application.
Cloud trace bills the ingested spans of a trace. In general, all custom spans recorded from a users’ application are billed. The free tier allows for 2.5 Mio. ingested spans per month without incurring any cost however.
| Feature | Price | Free allotment per month | Effective date |
| Trace ingestion | $0.20/million spans | First 2.5 million spans | November 1, 2018 |
[Table 1: Cloud Trace cost summary (Source)]
Cloud Monitoring mostly bills based on the data size of ingested metrics and the number of calls to the mointoring API.
| Feature | Price | Free allotment per month | Effective date |
| All Monitoring data except data ingested by using GKE workload metrics |
$0.2580/MiB1: first 150–100,000 MiB $0.1510/MiB: next 100,000–250,000 MiB $0.0610/MiB: >250,000 MiB |
All non-chargeable GCP metrics First 150 MiB per billing account for metrics charged by bytes ingested |
July 1, 2018 |
| Monitoring API calls | $0.01/1,000 Read API calls (Write API calls are free) |
First 1 million Read API calls included per billing account | July 1, 2018 |
[Table 2: Excerpt of Cloud Monitoring cost summary (Source)]
Pricing Considerations
The pricing considerations apply when using GCP Cloud Trace and Cloud Monitoring with OpenTelemetry as when using OpenTelemetry with AWS X-Ray and CloudWatch for an AWS hosted application. These services are managed by the Cloud providers and help to improve application observability without the need to operate and maintain a stack of monitoring solutions, like Prometheus and Zipkin. This must be factored in when evaluating the use of GCP’s integration of OpenTelemetry versus a self-maintained solution or the solution from other commercial providers. Since OpenTelemetry is being supported by commercial APM providers like Dynatrace, AppDynamics and NewRelic as well, work to instrument applications with OpenTelemetry may likely be leveraged when later migrating to commercial providers.
However, GCP’s OpenTelemetry integration for Java is less well integrated with the convenient OpenTelemetry auto-instrumentation agent than AWS’ ADOT, since support for the auto-instrumentation is in alpha state at the time of writing. Here, the recommended way to use OpenTelemetry with Cloud Trace is to adapt the application code to manually record traces and metrics, which requires development time before the potential of OpenTelemetry may be fully leveraged. The decision to use this integration should therefore ideally be made early in a project’s lifecycle, while more automated, commercial tools from other vendors may be better suited for later introduction of an APM or observability solution into a large application, despite their cost.
Conclusion
We’ve shown how GCP integrates OpenTelemetry into their managed tracing and metrics solutions, Cloud Trace and Cloud Monitoring Metrics. This integration offers a way to make an application observable by collecting traces and metrics using OpenTelemetry’s vendor neutral API, while using GCP’s integrated services for storage and inspection. Compared to AWS’ OpenTelemetry integration ADOT, GCP’s integration is less automated at the time of writing, but it nevertheless provides an alternative to using commercial observability and APM solutions. Using OpenTelemetry’s vendor neutral API to collect traces and metrics is also a good starting point to integrate with other commercial observability tools in GCP.