Tracing Applications on Payara with OpenTracing and Jaeger
Intro
The selection of open source tracing standards and solutions has been growing in recent years and so has support in various tools and application servers. This provides developers the opportunity to increase observability of their applications without having to build solutions from the ground up or having to solely rely on commercial solutions.
Payara is one such application server, which now offers a MicroProfile OpenTracing implementation. In this post, I will demonstrate which steps are necessary to set up a basic tracing for JEE applications deployed on Payara using the Jaeger Tracer, how tracing may be adjusted to be more fine-granular and how database calls of deployed applications may be traced.
Having been born from a fork of Glassfish, Payara provides an alternative to Glassfish, both as open source community edition and as enterprise edition. Payara has been offering a request tracing feature for some time but more recently transformed its own tracing solution into an implementation of the MicroProfile OpenTracing standard with version 5.192, finally adding support for other OpenTracing tracer implementations with version 5.194. This provides the opportunity to use other, established OpenTracing tools you may already be familiar with, like Jaeger.
Setting up Tracing in Payara using Jaeger
For testing purposes, a complete Jaeger setup may be deployed as docker container using the command below:
docker run --rm -p 6831:6831/udp -p 6832:6832/udp -p 16686:16686 jaegertracing/all-in-one --log-level=debug
More details about this setup can be found in Jaeger’s documentation: https://www.jaegertracing.io/docs/1.18/getting-started/#all-in-one. After the container is started, a Jaeger Collector will accept traces sent by a Jaeger Tracer and the Jaeger UI to inspect the collected traces will be accessible at http://localhost:16686. For more information about Jaeger’s components and its architecture, refer to our Blogpost “Open Source APM Tool Overview – Jaeger“.
To use Jaeger’s tracer instead of Payara’s own tracer for tracing deployed applications, it’s necessary to add an io.opentracing.Tracer implementation to Payara’s domain libraries, which wraps a Jaeger Tracer. Such an implementation is provided by the Payara foundation on Github: https://github.com/payara/ecosystem-jaeger-tracing
To use it, the project must be cloned, built, and installed as .jar library including its dependencies using the asadmin tool for a running Payara domain:
asadmin add-library jaeger-tracer-lib-jar-with-dependencies.jar
Finally, to start sending traces to a Jaeger agent, activate Payara’s request tracing feature using the following two commands:
asadmin set-requesttracing-configuration --enabled=true --dynamic=true
asadmin bootstrap-requesttracing
That’s it. Any application deployed in this Payara domain will now be traced using Jaeger’s tracer, which sends the recorded traces to the Jaeger Collector making them available for inspection in the Jaeger UI. The traces you’ll see are limited to all APIs that are automatically traced by Payara, which are https://blog.payara.fish/request-tracing-in-payara-platform-5.192:
- JAX-RS Methods and Client calls
- MicroProfile REST Client
- JAX-WS Method Invocations
- HTTP requests to Servlets
- WebSockets
- EJB Timers Execution
- Inbound JMS messages received by an MDB
- Creation of JBatch Jobs
- Concurrent executions using the managed executor service
In summary, the most common in- and outgoing calls of a JEE application will be traced out of the box. A notable omission from this list however are JDBC calls.
Demo Application
To demonstrate what the above configuration makes visible “out of the box” – or not – I will deploy a small demo JEE application, which offers a single REST interface (/hello), in turn calls a second REST interface (/foo) and finally persists an entity into a database. The used demo application is packaged as a .war and connects to a locally running PostgreSQL database using JPA (Eclipselink was used in this example).
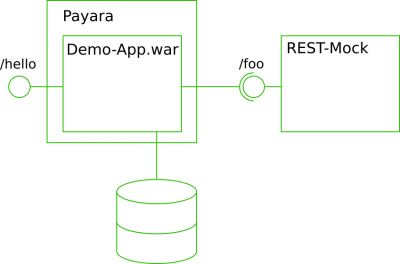
Architecture of the demo application
The core of the demo application lies in the REST service “HelloEndpoint” displayed below. Three EJBs are injected – a “FooClient” calling the mocked “/foo” service, a “FooDao” for persisting a “Foo” object and a ”TimeSpender”, which will wait for a random number of milliseconds on “spendTime()” before returning.
The mock Foo-service is realized using Wiremock configured to listen to http://localhost:9000 and using the request mapping displayed below. It accepts requests for /foo?param= and returns a body containing “Foo ” after a uniformely distributed random delay between 200 and 400ms.
The FooClient is shown below. It sends a request to the Foo service with a random string of three uppercase letters as param.
The TimeSpender halts the thread’s execution for a random number of milliseconds between 250 and 500:
A “Foo” entity merely contains a string and an ID of type long. It will be persisted using the FooDAO in a locally running Postgres database for test purposes.
The persistence.xml as shown below is configured to use the “jdbc/postgres” datasource from the Payara domain, which is backed by a ConnectionPool to the test PostgreSQL DB.
Traces out of the box
Sending the shown curl request to the Hello World service will result in traces being recorded by Jaeger.
curl http://localhost:8080/demo/hello

>Foo NGB
In the Jaeger UI, traces will show up for the service “jaeger-test” (which is the default name for the traced service when using the Jaeger Tracer Wrapper without further modification):
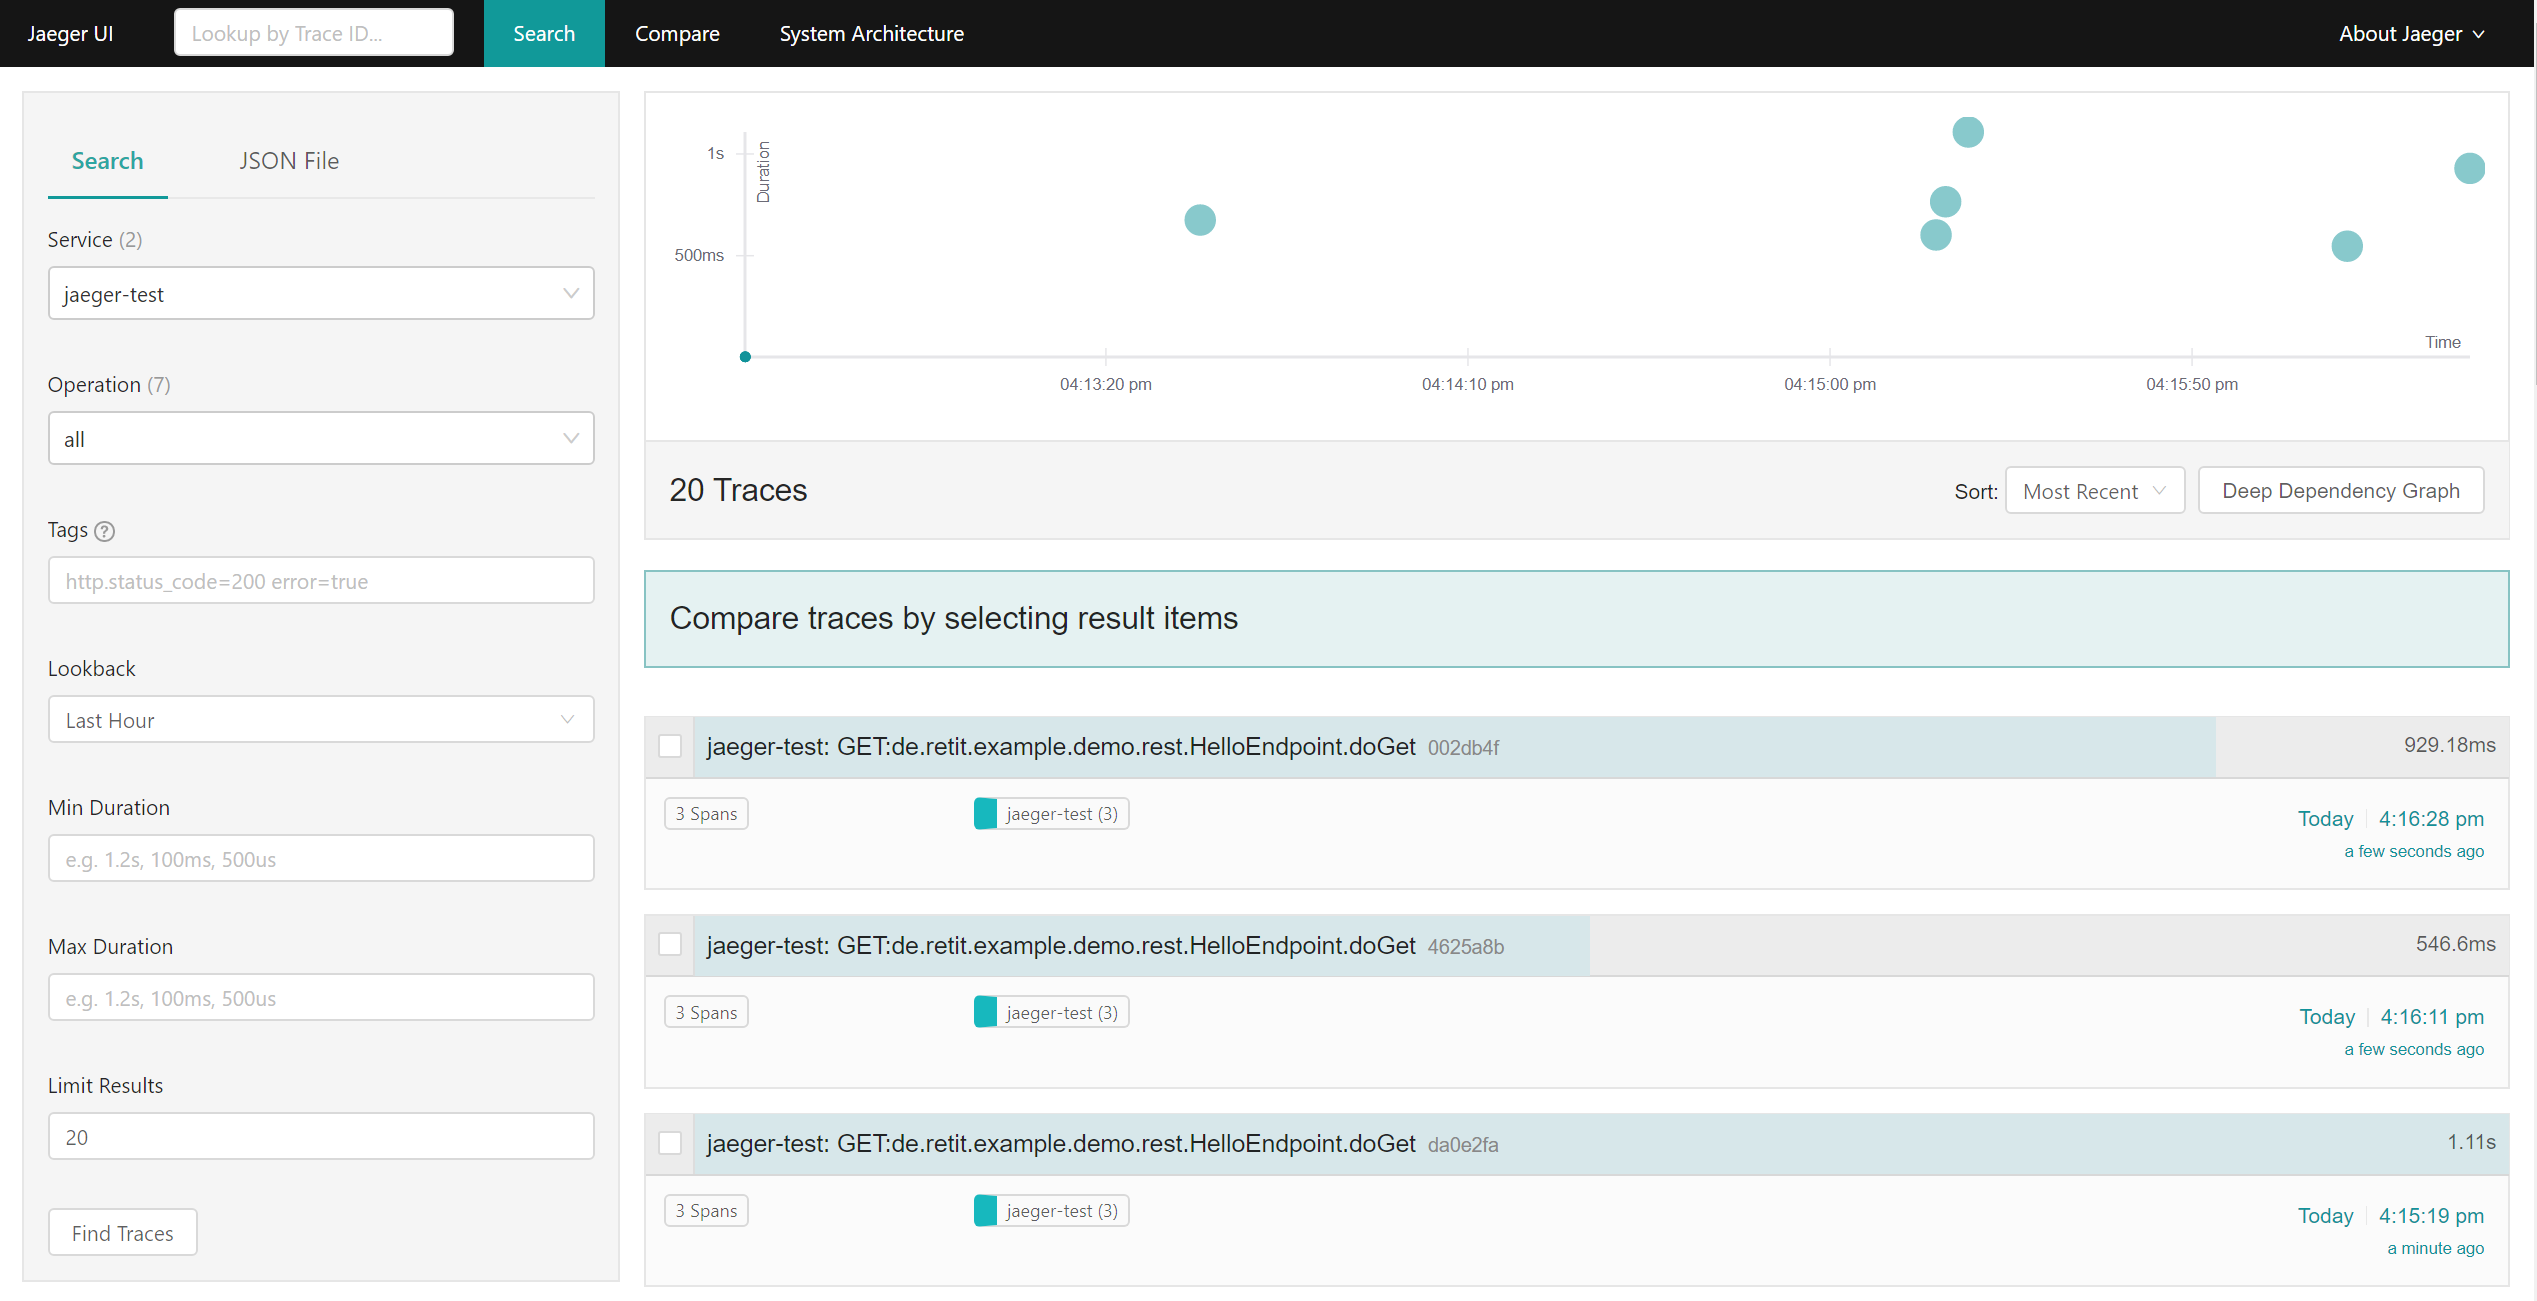
Traces of the demo application in Jaeger’s UI
Clicking on one of the traces and expanding the recorded spans will reveal that a GET request was sent to the application and a second GET request was sent by the application to the “foo” service. The incoming REST request will automatically create a trace with a span for the request itself and the outgoing REST request will create a child span. One example might look as shown in the screenshot below.
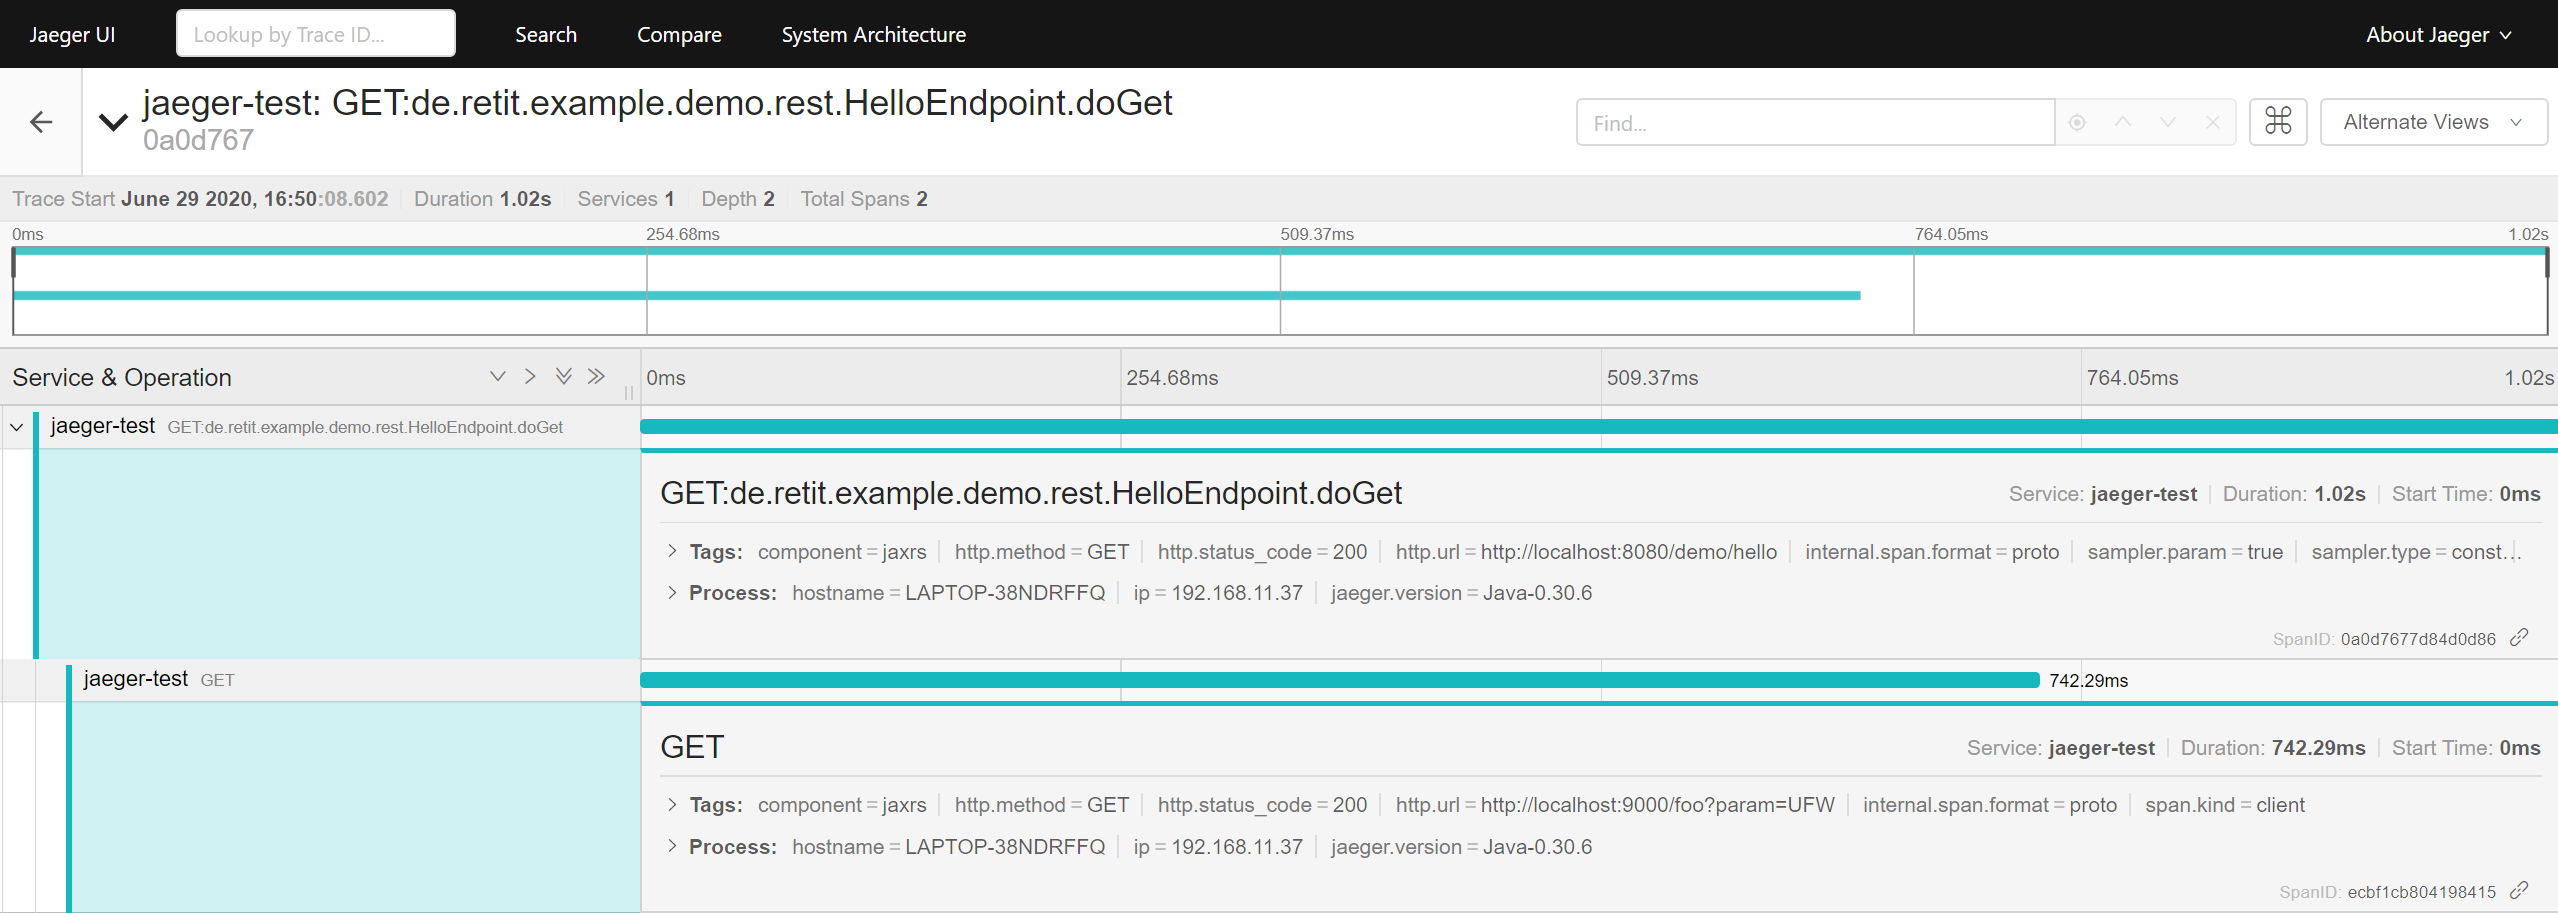
Details of a trace
Here, the root span took 1.02s and the nested HTTP GET request took ~742ms, leaving a timeframe of roughly 250ms unaccounted for. Within this timeframe, a Foo entity will be persisted using JPA and the TimeSpender.spendTime() method will be called. These happen through calls to internal Beans, which will not automatically be recorded as separate spans of the trace. Still, without further configuration the created spans will already provide information about in- and outgoing calls of the application and their duration. I would however also like to be able to trace internal calls, e.g. to the “TimeSpender” Bean, as well as SQL queries. This may be achieved by extending the default tracing behavior as demonstrated below.
Expanding Tracing to internal Calls
There are primarily two options for creating Spans for internal calls: Injecting a Tracer and manually creating spans or annotating methods using the @Traced annotation. Manually managing spans with an injected Tracer requires some code adaptions but offers flexibility (for more details refer to: https://blog.payara.fish/request-tracing-in-payara-platform-5.192). If the tracing requirements are less specific, it is more convenient to use the @Traced annotation, which is an interceptor for CDI Beans and can be added to methods or classes without having to do other modifications to the code. Methods that can be traced this way may not be static or private and must be called from another bean or via self-injection.
To use the @Traced annotation, the microprofile-opentracing library must be added to the deployed application as dependency – e.g. when building the application using Maven:
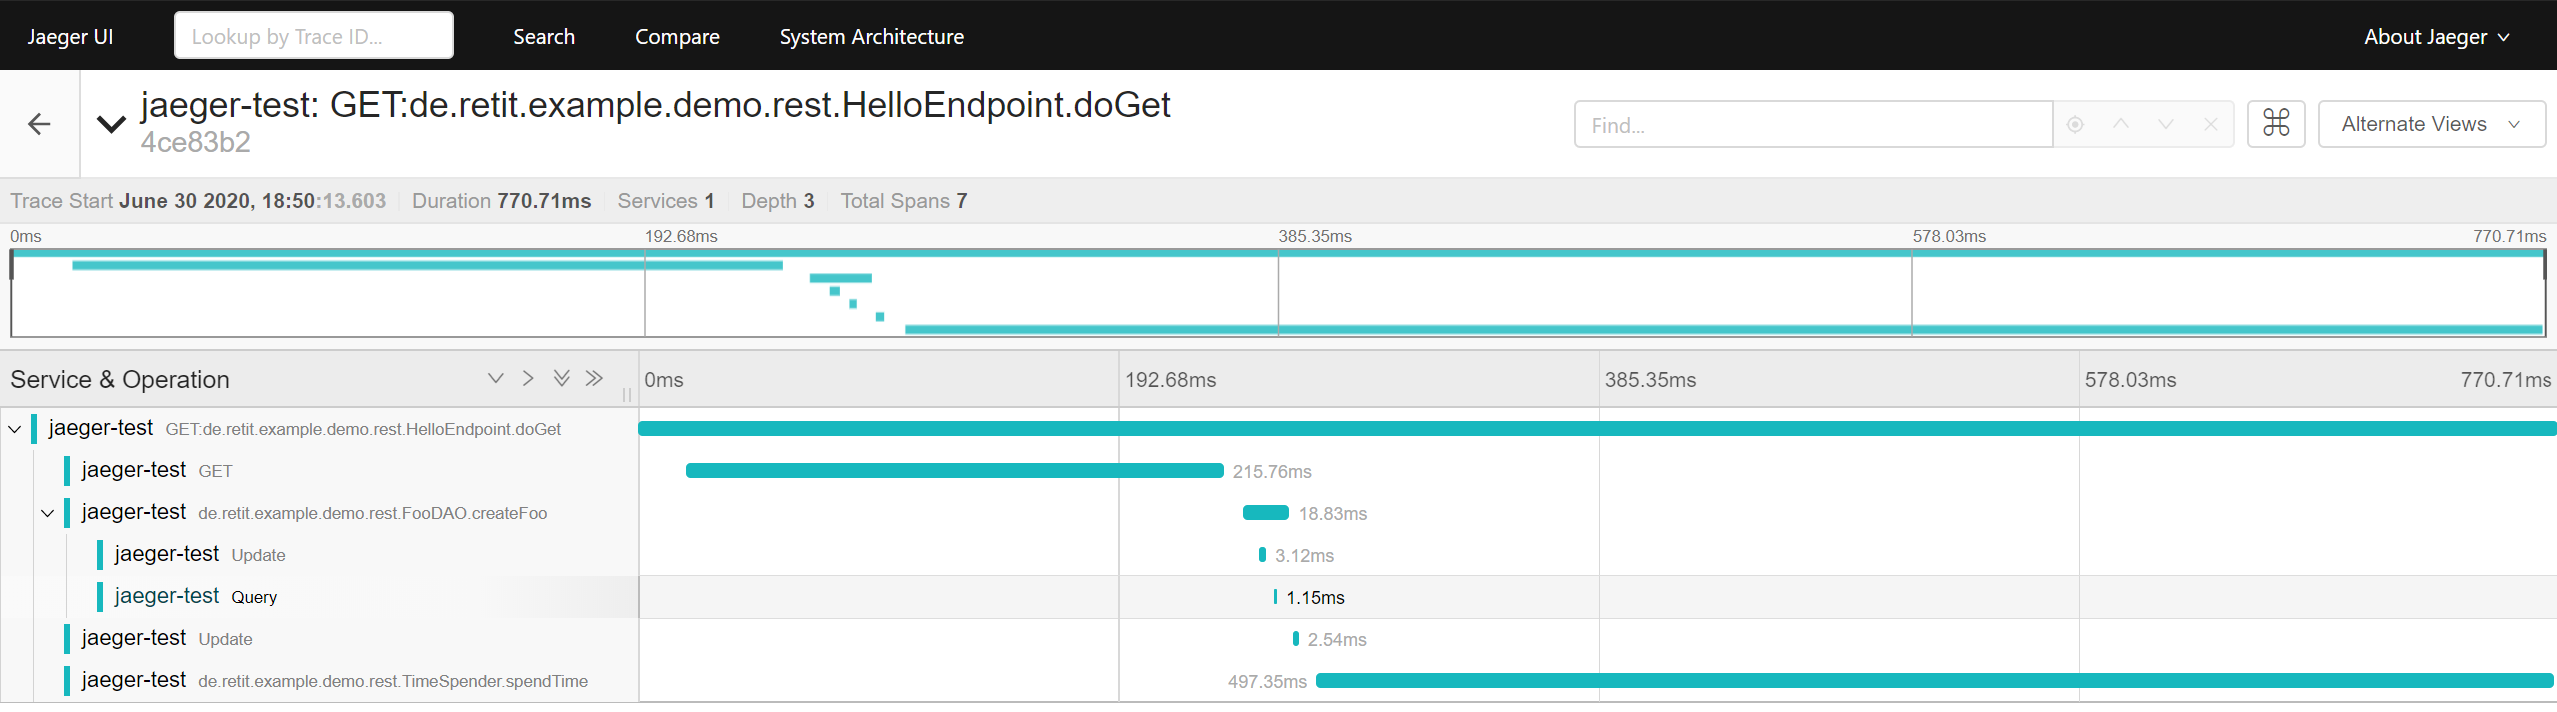
Adding the @Traced annotation to the TimeSpender.spentTime() and FooDAO.createFoo() as below will create separate spans for their execution in a request’s trace.
Inspecting these spans will will reveal how much time is spent for the methods‘ execution:
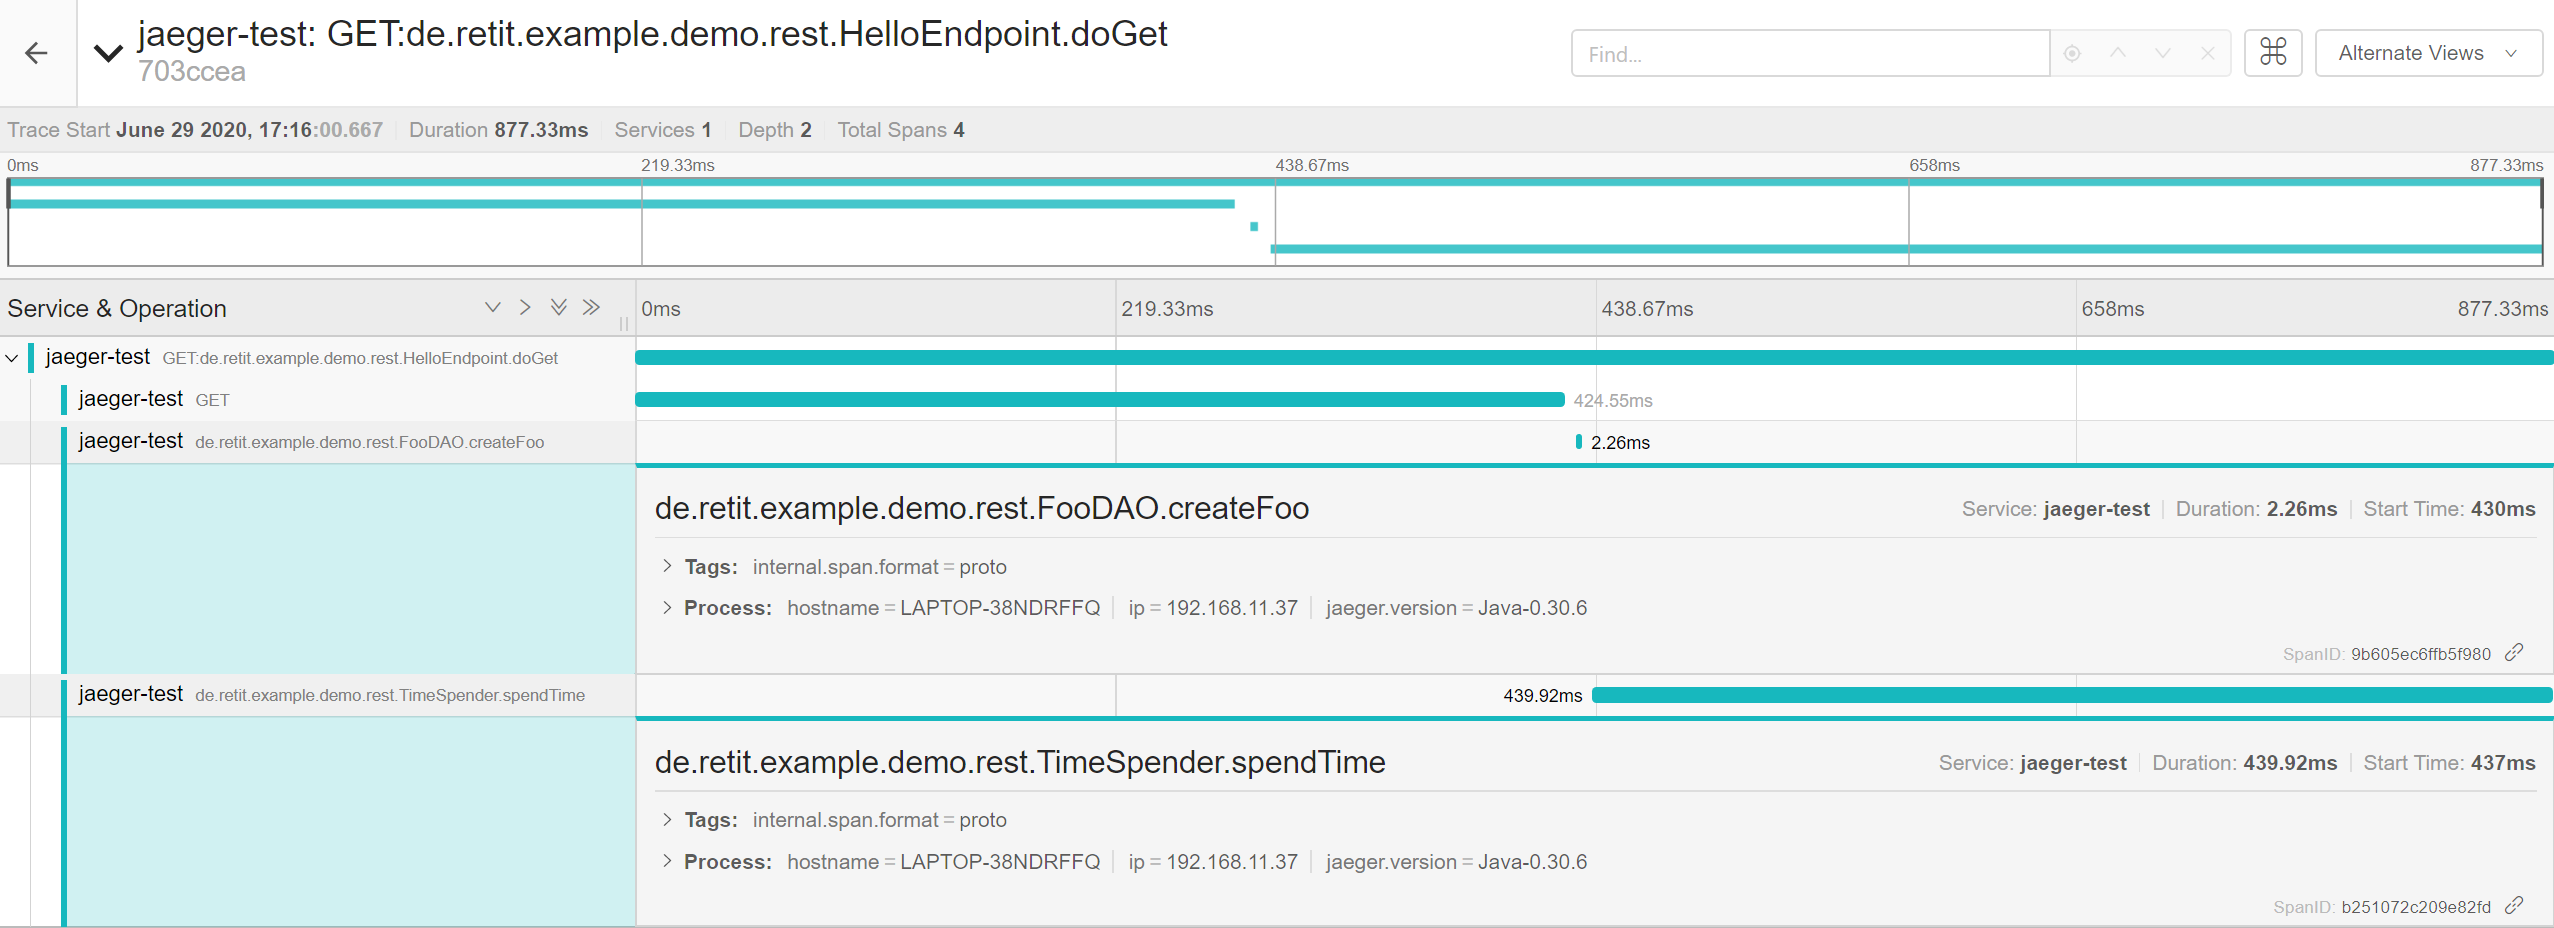
Traces expanded with additional spans for internal calls
Tracing JDBC Requests
Annotating the „FooDAO.createFoo()“ method with @Traced was sufficient in this example to at least get an idea of the time spent for the DB query, since the method contained little other logic than is necessary to persist a Foo entity. In a more complex scenario however, when recording a span for a method with database access and other business logic, it may not always be as apparent how much time is spent on business logic and how much is spent on database queries. Even more so when using JPA as an ORM layer. As such it is often important to trace DB requests down to their SQL statements to identify potential performance bottlenecks. But as shown, Payara’s tracing support unfortunately does not automatically record DB queries and their execution time. This issue may be addressed by configuring Payara’s DB connection pool to be wrapped with a traced DataSource provided by the OpenTracing instrumentation for JDBC, which is a contribution to OpenTracing (https://github.com/opentracing-contrib/java-jdbc). While I will demonstrate a way to do this, it comes with the disclaimer that this setup ought to be limited to test environments, since it does not work with a pooled javax.sql.DataSource in a JEE context*.
* Between the versions 0.31 and 0.32 of the OpenTracing standard, incompatible API changes were introduced. Payara’s most recent release still uses OpenTracing 0.31.0 and therefore is not compatible with newer implementations of the OpenTracing standard (https://github.com/payara/Payara/blob/170fc8a0393c9a2a5da48635631da9fbef085abe/pom.xml#L212). OpenTracing JDBC 0.0.12 (https://mvnrepository.com/artifact/io.opentracing.contrib/opentracing-jdbc/0.0.12) is the last release to be compatible with OpenTracing 0.31.0 and thus Payara’s OpenTracing feature, while all newer releases of Opentracing-JDBC use a newer version of the OpenTracing standard. In Opentracing-JDBC’s release 0.0.12 however, only a traced java.sql.Driver to wrap another JDBC Driver is provided, not yet a javax.sql.DataSource to support connection pooling.
Still, to make JDBC SQL queries visible as spans, the opentracing-jdbc-0.0.12-jar library (https://mvnrepository.com/artifact/io.opentracing.contrib/opentracing-jdbc/0.0.12) may be added to the Payara domain:
asadmin add-library path/to/opentracing-jdbc-0.0.12.jar
Afterwards, a new ConnectionPool must be created using the io.opentracing.contrib.jdbc.TracingDriver:
asadmin create-jdbc-connection-pool --driverclassname 'io.opentracing.contrib.jdbc.TracingDriver' --restype 'java.sql.Driver' --property url='jdbc:tracing:postgresql://localhost:5432/postgres':user=postgres:password=postgres opentracing-test-pool
In the shown example, the ConnectionPool “opentracing-test-pool” connects to the test database available at “jdbc:postgresql://localhost:5432”. To make the connection traced however, the URL is modified by adding “tracing” between the “jdbc” prefix and database type. Once set up successfully (the vendor’s JDBC driver must also be available as a library in Payara’s domain), the ConnectionPool may be tested:
asadmin ping-connection-pool opentracing-test-pool
> Command ping-connection-pool executed successfully.
Now, only the jdbc resource “jdbc/postgres” used by the demo application must be created to use the “opentracing-test-pool”:
asadmin create-jdbc-resource --connectionpoolid opentracing-test-pool jdbc/postgres
After deploying the demo application and sending requests to the demo service, inspecting the traces reveals that individual spans are created for SQL statements.
Spans created for SQL queries
A closer look at the spans‘ details reveals that a sequence was first updated, then queried and finally a value was inserted into the table „FOO“, as well as how long the individual queries took to complete.
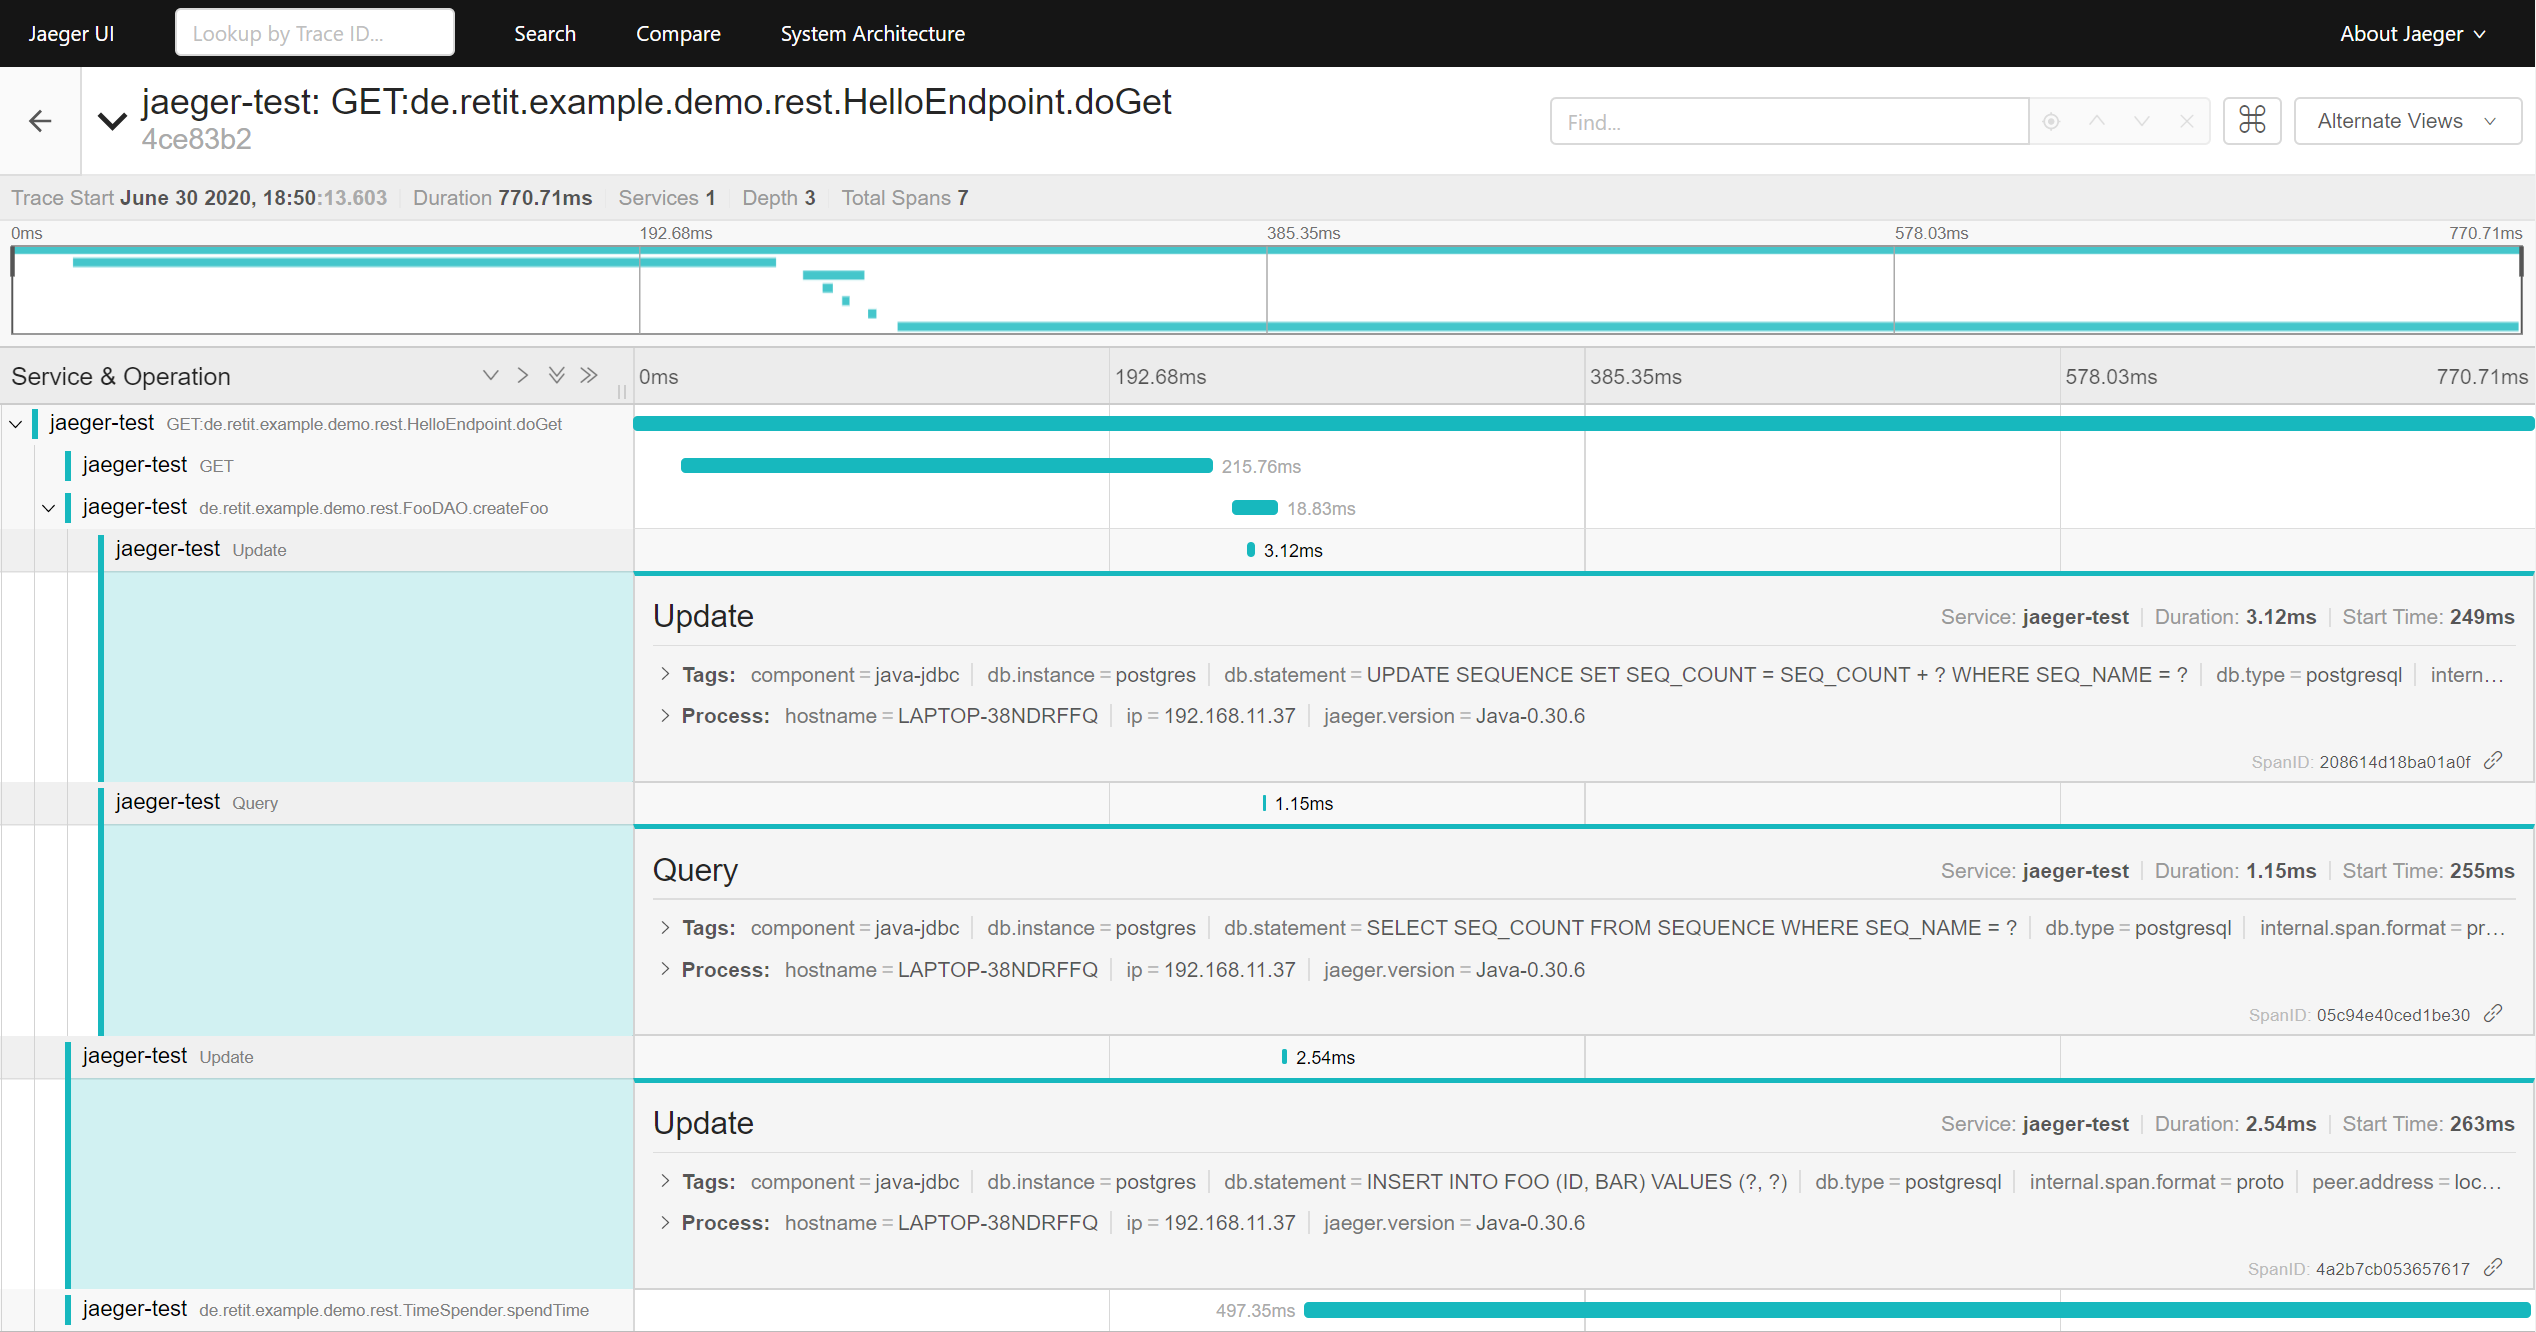
Details of the spans created for SQL queries
Conclusion
The increasing support for open source tracing standards like OpenTracing, as demonstrated for a JEE application deployed on Payara using Jaeger, makes basic tracing easily accessible to developers wishing to improve observability and gain insight into their application’s runtime behavior. More fine-grained tracing may require further adaption of the application and additional configuration but is also possible using only available open source solutions. Unfortunately, at the time of writing Payara supports a slightly outdated version of the OpenTracing standard, which limits the use of automatic instrumentation for JDBC calls. Beyond basic tracing, this may also warrant a look at other, more automated solutions for instrumenting and tracing your Java applications, like InspectIT Ocelot (https://github.com/inspectIT/inspectit-ocelot), which is based on the OpenCensus library.
Meanwhile, the open source tracing community keeps evolving. The two tracing standards OpenTracing and OpenCensus have merged into OpenTelemtry (https://www.cncf.io/blog/2019/05/21/a-brief-history-of-opentelemetry-so-far/, https://opentelemetry.io). As the new unified standard matures, support for it may be expected to grow as well, offering ever more open source options to improve an applications observability.