
One major trend in IT has been the adoption of DevOps and continuous delivery principles. Many businesses have introduced continuous integration systems, trying to improve software quality and push out features in increasingly shorter release cycles. While functional requirements are rigorously evaluated in these environments to avoid breaking the application, non-functional requirements such as performance are often neglected. Some companies run sporadic load tests every few months, but this is usually not enough – one week after the load test, a major performance bug could be introduced, affecting end users for a long time. This is only made worse by the fact that finding and fixing a performance bug in production is much more expensive than doing the same during development stage. Therefore, it is important to continuously evaluate the performance of all applications.
Modern application performance management (APM) solutions often include features for tracking an application’s performance over the course of multiple application versions. Some also come with built-in analytics to automatically detect any performance deteriorations, in which case an alert is sent to the developers to inform them of the problem. However, these tools generally come with a high price tag, and therefore might not be an option for everyone. But a pipeline for continuous performance evaluations can also be built using only open source tools. In this article, we will show you how and also provide you with a small example setup as a starting point.
General workflow
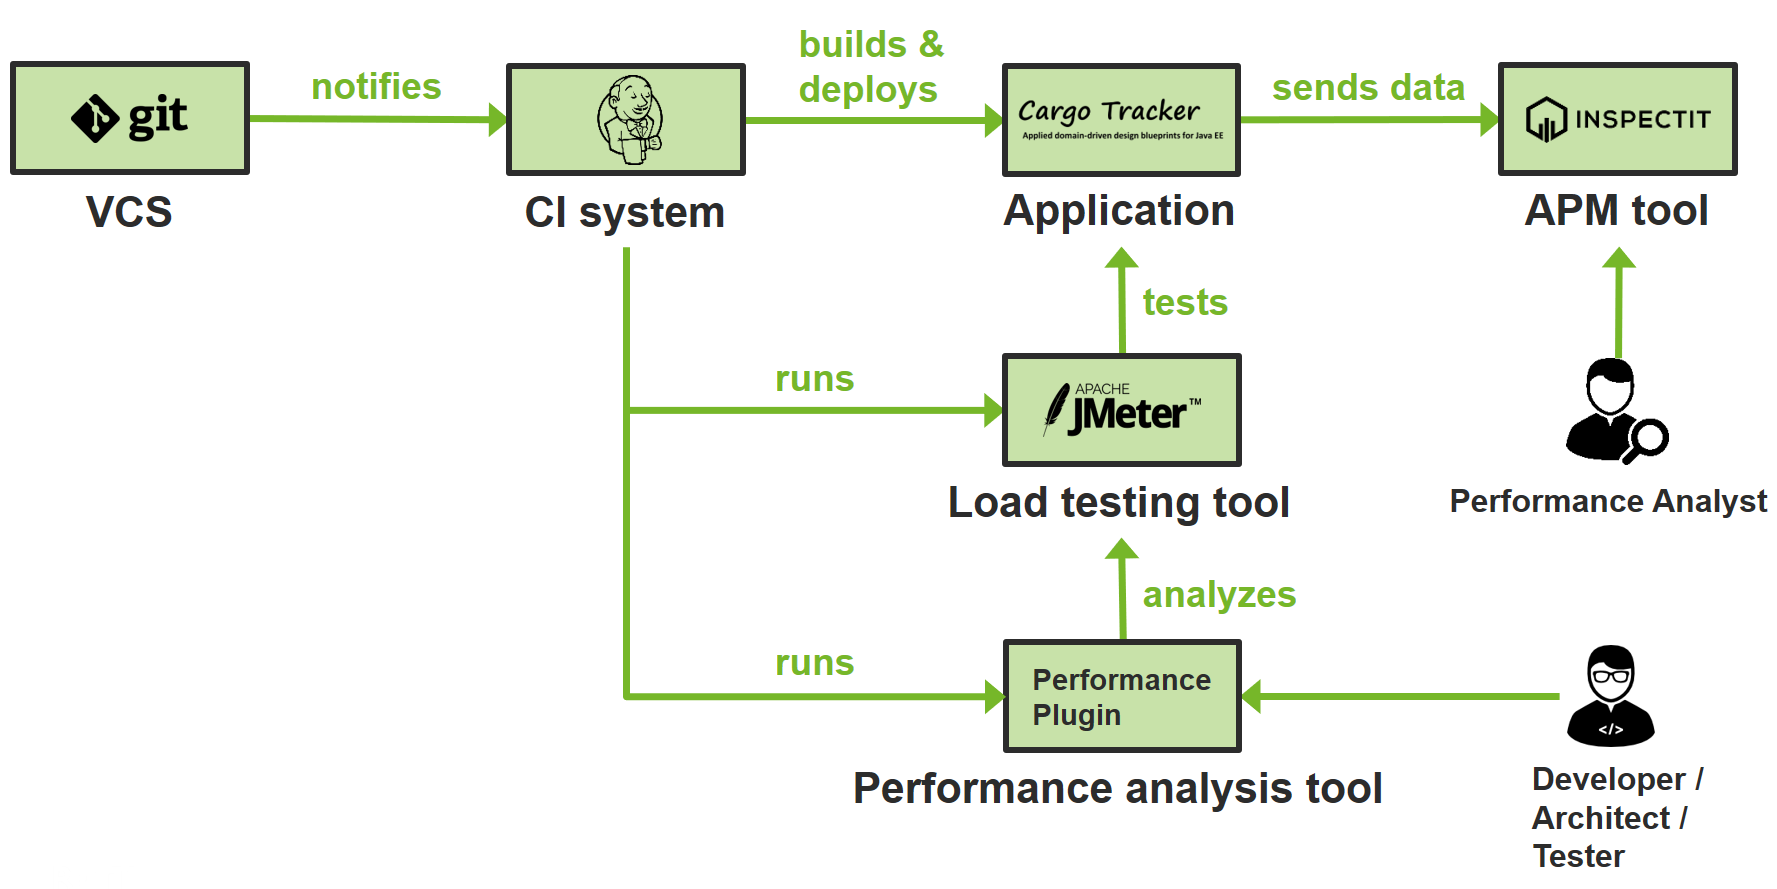
The general workflow of such a pipeline is always the same and is depicted in the above figure. The entire code for the application is stored in a version control system (VCS) such as Git. When a developer commits a change to the code, the VCS then notifies the continuous integration (CI) system of this change, which is then responsible for all subsequent steps. The CI system will build the new application version and might also run a set of functional acceptance tests. Usually, the CI system will also trigger the application’s deployment onto a test system. The application should automatically be instrumented using some APM tool so that data is collected when the application is accessed.
After deployment, the CI system will run some load testing tool that will generate load on the system under test. This will result in data being sent to the APM tool, and the load testing tool itself will also create some output, which can then be analyzed by a performance analysis tool. Such a tool can be integrated into the CI tool, but its features are also often included in commercial APM tools. Its purpose is to analyze the performance of the new application version and verify that the performance has not degraded – if it has, the tool will mark the build as failed or unstable and also notify developers of this. One benefit of having a separate tool for this is that developers, architects and testers don’t have to dive into the depths of the APM tool to be informed about performance changes. An example for such a tool would be the performance plugin of Jenkins.
Open Source Alternatives
We already proposed some tools in the above diagram, but there are many alternatives for each of the individual tools. For example, instead of using Jenkins for your CI tool, you could choose an alternative from this (incomplete) list:
- CruiseControl
- Bamboo (Closed Source)
- TeamCity (Closed Source)
And while JMeter is one of the most popular open source load testing tools, maybe you might want to opt for one of these:
- Gatling
- The Grinder
- Tsung
- LoadRunner (Closed Source)
- Silk Performer (Closed Source)
Finally, you have to decide on an APM tool. This is probably the hardest decision, just because there are so many options available, all with different features and capabilities. We chose inspectIT for our demo, but there are many alternatives:
- Kieker
- ICINGA
- Zipkin
- Pinpoint
- ZMON
- AppDynamics (Closed Source)
- Dynatrace (Closed Source)
- Instana (Closed Source)
- New Relic (Closed Source)
- … and many more
We’re not going to go into detail about all the tools and their differences, but you should definitely look into them and try them out for yourself. There is no best tool for every use case – every task is different, which is why it is important to choose a tool that is appropriate for a specific task.
Demo
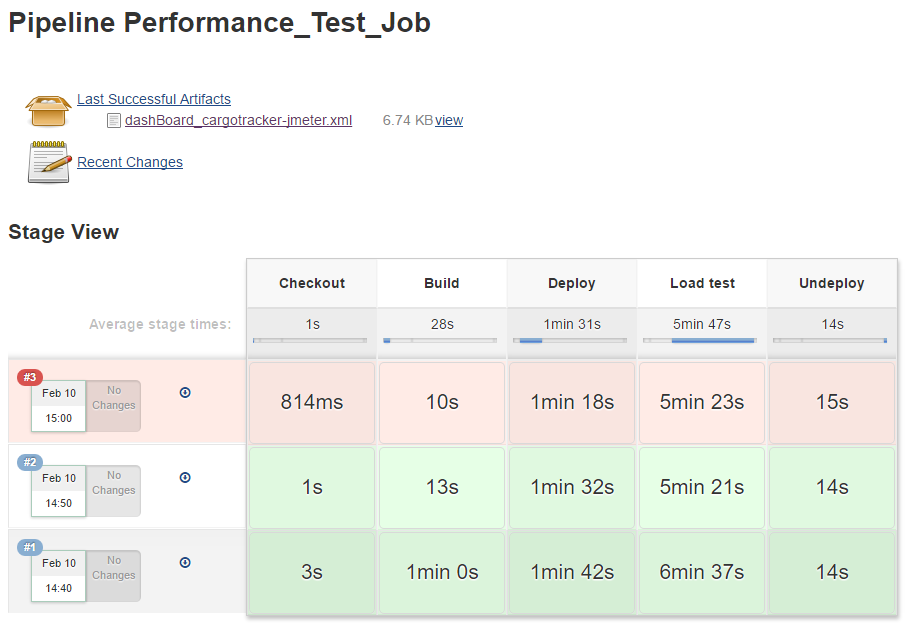
As already mentioned, we built a small demo pipeline which uses the workflow described above and implements it with the open source tools depicted in the diagram. You can find the demo on GitHub – feel free to fiddle around with it or take it as a starting point for your own project. It only requires Docker, then you’re good to go.
The demo contains the following components:
- Pre-configured Jenkins
- A Jenkins slave running in separate Docker container
- InspectIT Central Measurement Repository (CMR)
- A sample application (Cargo Tracker), running on WildFly 10 with PostgreSQL in the background
When you execute the pipeline, Jenkins will automatically set up the application for you, run the load test and check afterwards whether the performance has changed using the performance plugin. You can then also have a look at the application data in inspectIT. After running the pipeline once, you could try and change the application code wherever you want and introduce a performance bug such as the following:
for(int i = 0; i < 300000; i++)
Math.random();
Will the pipeline notice the change? And will you be able to localize the changed method in inspectIT?
Tips
Finally, we want to give you a couple of helpful tips which we learned while implementing this workflow in the course of multiple customer projects.
Tip #1: Use Pipelines
Since version 2.0, Jenkins comes with a feature called pipelines. Pipelines let you declare Jenkins workflows using Groovy scripts instead of manually configuring everything in the Jenkins UI. This is a powerful tool, because it lets you treat your pipeline as code. This means that you can put your pipeline into your VCS, which gives you all its benefits such as tracking changes over time. Furthermore, you are mostly independent of your concrete Jenkins instance, since all information is stored in the VCS. In comparison, manual configuration of jobs in Jenkins is cumbersome, error-prone and not very flexible once your pipeline reaches a critical size. We really encourage using the pipeline feature when realizing your own performance evaluation pipeline.
Tip #2: Use Load Test correctly
Load tests only yield meaningful results if they are used correctly, which is surprisingly difficult since many aspects need to be taken into consideration when designing your load tests. Among other things, ensure that…
- … your workload resembles how actual users would access the application. This is important because all the testing goes to waste if your test workload is different than your production workload. Ideally, you would try and extract your test workload from actual production data such as webserver logs.
- … you achieve steady state performance. Most systems need some time until they are at full performance, be it due to mechanisms like caching or just-in-time compilation. The time span before the system is in a steady state is called warm-up or ramp-up period. Your load test results will only be stable when you don’t take the ramp-up period into account. Therefore, make sure that your load test is long enough to reach steady state. You can also cut off data collected during warm-up phase, if necessary.
- … your test environment has no external influences. Most importantly, ensure that your load test is running on a separate machine, since otherwise your results will be affected negatively.
- … your test environment is comparable to your production environment. This is one of the most important factors, because many businesses can’t or don’t want to invest in a test environment that is just as expensive as the production one. However, while test results collected on a smaller environment are a legitimate way to get a very rough idea of the system’s performance or to detect regressions, you should not try and transfer such results to the production environment. The reasoning behind this is that most systems don’t behave linearly; furthermore, such an approach assumes that the bottleneck in both environments will be the same, which is not always the case. Therefore, we strongly encourage to use a similarly sized test environment for your performance evaluations. In case this is not possible, you might also be interested in our product RETIT Continuous Delivery, which alleviates this problem.
Tip #3: Find good Thresholds
Notifications are the most important part of your pipeline. It is important that developers are notified when the application’s performance changes – if your pipeline requires developers actively looking at the tool to detect changes, they most likely won’t do it.
Modern APM tools often have special features such as anomaly detection to automatically find out when the performance has changed significantly. When such features are not available, simple thresholds can be an effective replacement. However, of course they require a lot more work than any automatic approaches. Most importantly, it takes time to properly calibrate the thresholds and find ones which fit your specific application and workload well. This is important because developers will start ignoring any warnings if the thresholds are set too low and too many false positives occur – conversely, if the thresholds are too high, potential performance problems might go unnoticed. As already mentioned, finding good thresholds takes time and might also involve using absolute thresholds or individual thresholds per transaction.
Tip #4: Run the Pipeline often
Naturally, you should run your pipeline as often as possible so you can find performance problems as fast as possible. Ideally, you would run your pipeline after every commit; but since proper load tests take time, this will not always be possible. The bare minimum we recommend to customers is once a day.
If you only run your pipeline once a day, another question in this regard is what time of day is a good time for running your pipeline. Many customers tend to run their pipeline at night time, just because this is the only time they can ensure that the test systems are available and not influenced by other activities in your network. However, if somehow possible, we suggest to run it during work hours, most preferably during lunch break. This has the added benefit that your employees will still be available when performance changes are detected and can therefore fix them as soon as possible.
Besides these considerations, you can also simply run your pipeline more often by minimizing your pipeline run time.
Tip #5: Optimize your Pipeline
There are many techniques for optimizing your pipeline. The first strategy is to minimize the amount of data which needs to be processed, sent around or stored in any way. Examples of this are using JMeter’s CSV output instead of XML or introducing log rotation in your Jenkins pipeline to avoid storing all build results. But this can also be applied to your general test design: for example, if you have a very large database behind your application, it might not be the best idea to perform a full restore for every iteration of your test. Instead, you can use partial database resets, e.g. by only deleting the data which was generated during the last test execution.
Another technique which is important in this regard is the effective use of caching mechanisms. Properly using Maven’s local repository or Docker’s image cache can help you a lot. For example, you shouldn’t download the JMeter binary from the internet for every test run – instead, you can either use the Maven JMeter plugin and thus make use of Maven’s local repository, or you could bundle everything in a Docker image. Or just put it in some local storage where you can access it faster than over the internet. Any of these options will not only make your pipeline faster, but also less dependent on external systems and thus more reliable.
Conclusion
By evaluating your application’s performance as part of your deployment pipeline, you can continuously detect performance changes. This helps you to fix any performance bugs as soon as they come up and thus prevents that any end users get affected by them. While a proprietary APM tool can help you to find the root cause of problems faster, many open source tools also get the job done.
Regardless of what specific tools you use for your pipeline, the general workflow is always the same. If you want a starting point, you can have a look at our demo pipeline on GitHub. By following our tips, you can ensure that you make the most of your pipeline. If you have any questions or need assistance in setting up your own performance evaluation pipeline, feel free to drop us a message.